Introduction to Qualtrics
The Survey options section of Qualtrics allows you to make a range of other changes to your survey settings, from adding a back button to sending post-survey emails and setting up scoring. To access this section of Qualtrics, click on the ‘Survey options’ icon on the navigation menu at the far left of the screen. It looks like this:

This page details some of the functionality available in this section of Qualtrics.
In brief, it covers the following:
- The standard options available, including the option to add a back button
- How to add scoring functionality to a survey
Standard options
The Survey options section contains five different options. Details of the first four of these are as follows, while the remainder of this page focuses on the ‘advanced’ option, Scoring:
- The General option allows you to change things such as the survey display name and description, and to display question numbers to respondents.
- The Responses option allows you to add a back button to your survey, and to update settings with regards to survey completion and availability.
- The Security option allows you to limit the availability of your survey, to add password protection and to anonymise responses.
- The Post-Survey option allows you to display and send customised messages and emails to survey respondents (while this includes the creation of email triggers, note that the email task feature of Workflows is currently recommended for this due to improved functionality).
Example
Add a back button to your Test Survey by selecting Responses from the left menu, then toggling on Back button (note that you may then want to change the text of this button, either for the whole survey or for specific block(s), as detailed in the Look & feel and Survey builder pages respectively).
Add visible question numbers to your Test Survey by selecting General from the left menu and toggling on Question numbers (just make sure you renumber your questions if required, as detailed in the Survey builder page).
Scoring
You can use scoring to assign point values to certain types of questions in your survey, including multiple choice, matrix, text entry and slider questions (see here for a complete list of compatible question types). Furthermore, you can use multiple scoring categories, display scores to respondents in different places and in various ways, and customise the survey based on the respondent’s score/s.
Calculating and displaying scores
To add scoring to a question or questions, select Scoring from the Survey options section of Qualtrics. The default is that there is one scoring category called Score, but you can rename this and/or add new scoring categories by selecting the Score category and clicking on Manage Categories…, or by selecting Scoring Options. To rename a category click on its name (make sure you click on the text itself), or to add a new scoring category select New Category…. At this point you can also elect to have the scoring shown at the end of the survey or after each question if desired, and you can decide what to do with empty statistics for scoring categories (the default is to treat them as 0). Once you are happy with your selections click Save.
Next, scroll through the questions in your survey on the Scoring page and assign scores to different questions and response options as required (making sure you have the relevant scoring category selected from the menu at the top, if applicable). Note that selecting Auto for any particular question will automatically score the responses in ascending order starting at 1.
Once you have finished, select Back to survey builder to navigate back to the survey. You may then like to include a score or scores as part of survey questions by using piped text (as detailed in the Question behaviour section of the Survey builder page), particularly if you did not elect to have scoring displayed automatically at the end of the survey or after each question.
Example
Let’s add a travel knowledge question to your Test Survey and use this to calculate and display a Travel Readiness score.
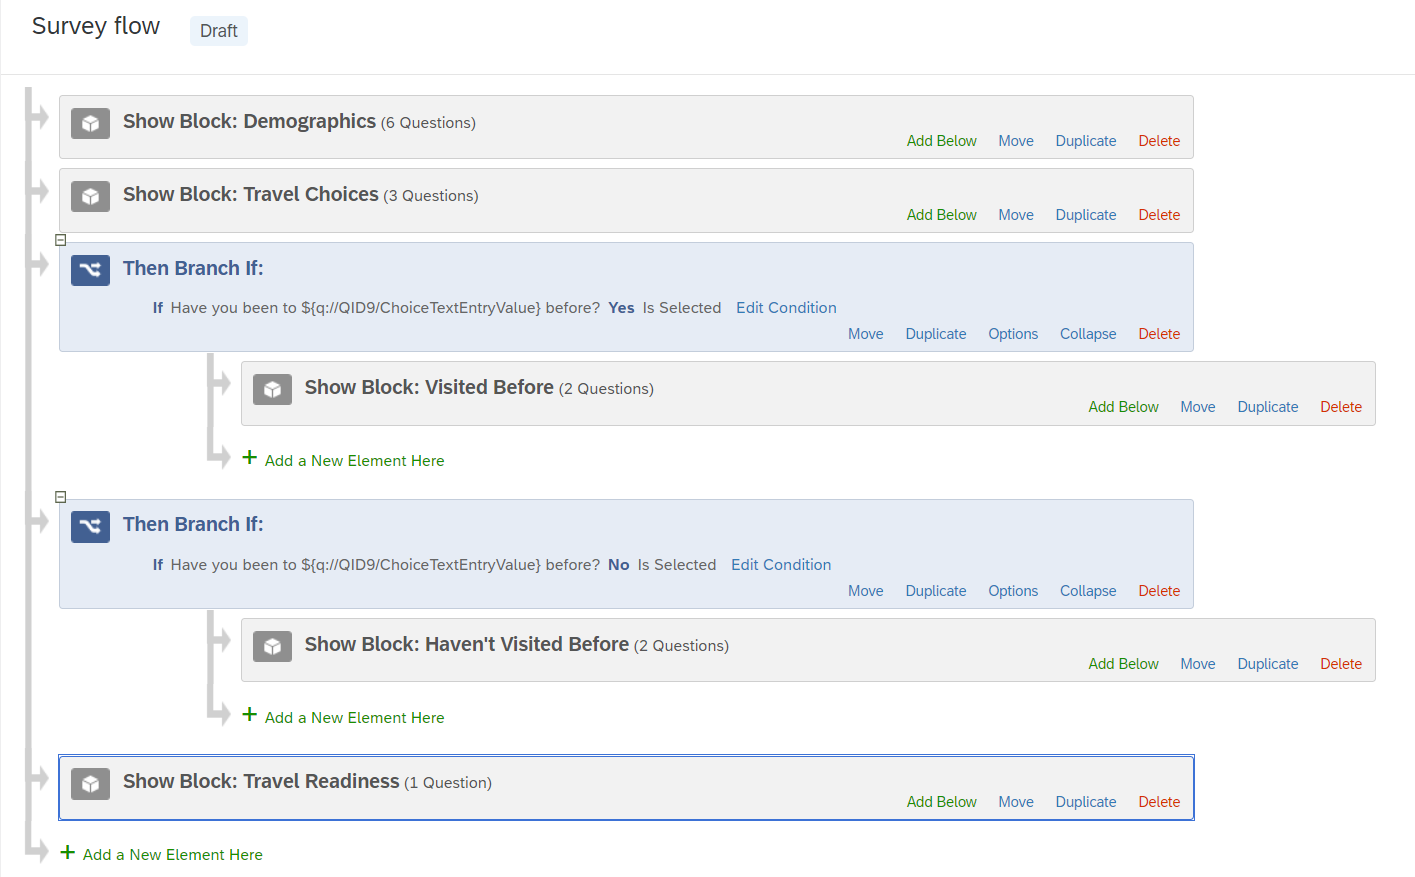
To do this, first add a new ‘Travel Readiness’ block to the survey, then navigate to the Survey flow section and move the new block so that it sits outside any previously created branches (if you have created these). If applicable, it should look like this:
Next, add a question with options relating to travel readiness. An example has been created below, but you could create a shorter version if you wish.
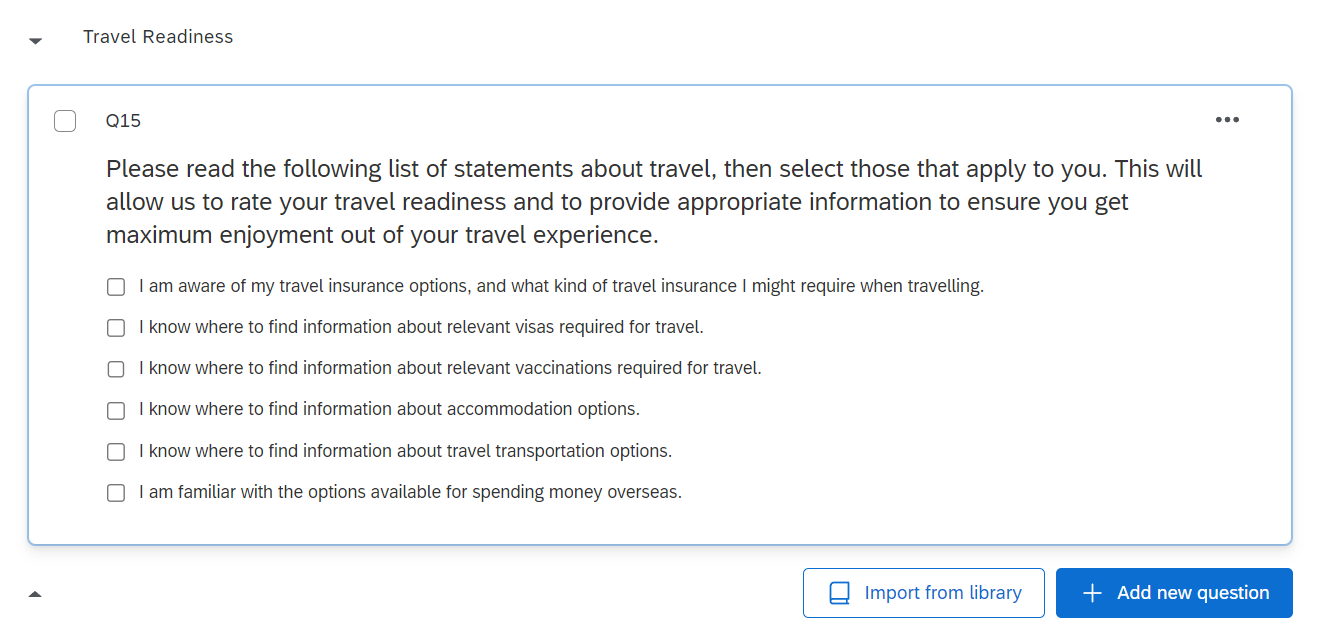
In the Answer type section of the Edit question menu on the left, make sure that you select Allow multiple answers for this question so that respondents can choose multiple statements (alternatively, you could create a set of separate ‘Yes’ or ‘No’ questions if preferred).
To add scoring to this question go to Survey options and to Scoring, then select the Score category up the top and click on Manage Categories… (or click on Scoring Options).
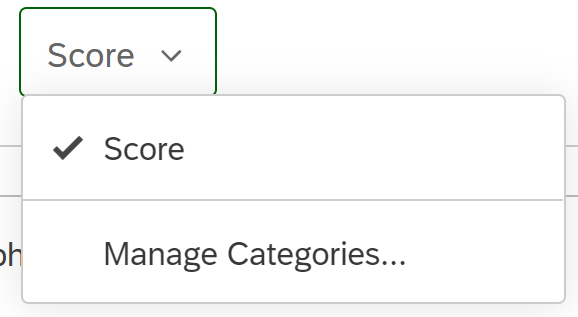
Now select Score and rename it to Travel Readiness (while this is optional, it is helpful to give your scoring categories relevant names - particularly if you are going to have more than one). Keep the two Show Scoring Summary for Category options unselected (as we will use piped text to pipe the score), and keep the Treat empty statistics for scoring categories as 0 box selected. Select Save.
Next, scroll down to the ‘Travel Readiness’ block in the Scoring page and assign a value of 1 to each of the response options for the question by selecting them in turn (as we want the score to be the number of options selected). Once you have done this, select Back to survey builder to return to the survey.
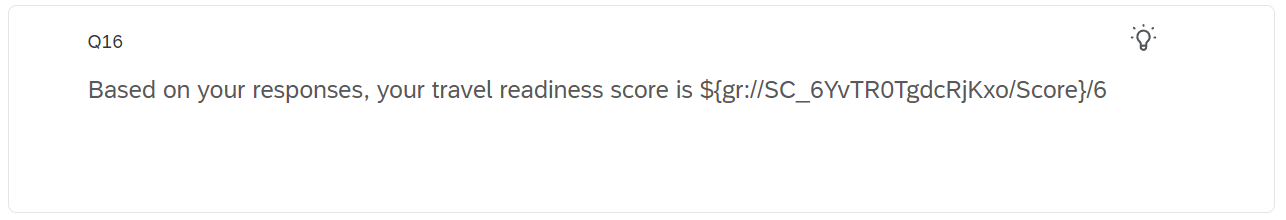
To display this score to the respondent in context on the following page of the survey, add a Text/Graphic question below the travel statement question – adding a page break in between so that the score shows on the next page. Next, use piped text (as detailed in the Piped text section of the Survey builder page) to include the score in a sentence. When you do this, you will need to select Scoring, Travel Readiness and Score for the piped text. You may also like to add /6 after the piped text so that it appears as a score out of 6 to the respondent. Your question should look something like the following (note the score ID may be different in your piped text):
Using logic with scoring
While you can include information for the respondent in one question about what to do in the case of different scores, as a next step you may want to customise your survey to provide different responses to the respondent based on their score.
One way of doing this is using branch logic, and in particular you would use this if you wanted to display a different end of survey message depending on the respondent’s score. For instructions on doing this see the Qualtrics support page on displaying messages based on scoring.
Another way of doing this is by making use of display logic (as detailed in the Question behaviour section of the Survey builder page) to display a different response (i.e. survey question) depending on the score. Doing this requires you to add an Embedded Data element (as detailed in the Embedded data section of the Survey flow page) in the survey flow. Note that this needs to sit below the block where the score is calculated, and above the block where you want to use the data. You can then use this embedded data as part of the display logic for a particular question or questions.
Example
Let’s use display logic to provide different feedback depending on the Travel Readiness score generated in your Test Survey. To do this, first move the previously created results question (in which you used piped text to display the score) to a new block called ‘Travel Readiness Results’. This should sit below the ‘Travel Readiness’ block.
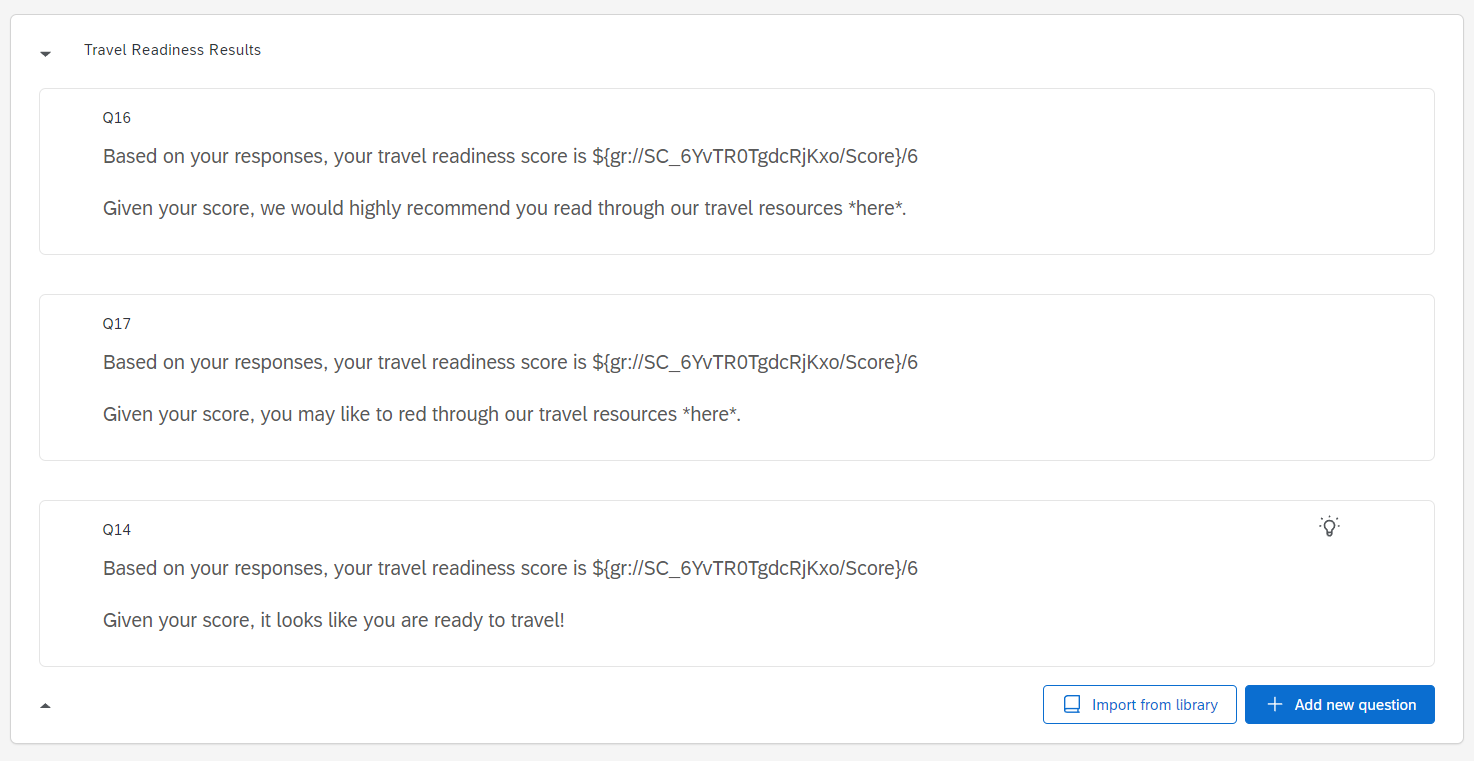
Next, adjust the text of the question so that it is relevant to people who did not obtain a good score (for example, who obtained a score between 0 and 2), then add two more similar questions which are relevant to people who obtained a good and a perfect score respectively. The result should look something like this:
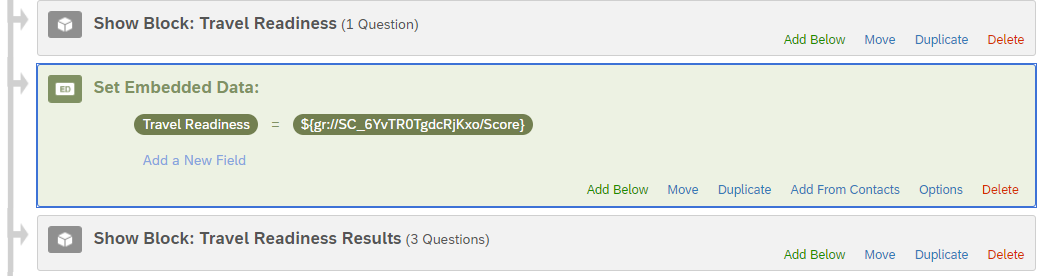
In order to add display logic for these questions based on the scoring, you first need to add an Embedded Data element to the survey flow. This needs to sit below the ‘Travel Readiness’ block (i.e. below where the score is calculated) and above the ‘Travel Readiness Results’ block (i.e. above where the data is used).
Type the name you wish to give to the embedded data inside the box; for example, Travel Readiness. Next, set the value of this embedded data to be the ‘Travel Readiness’ score, by clicking the blue Set a Value Now text, choosing Insert piped text, Scoring, Travel Readiness and then Score. It should look something like this (note that your score ID may be different):
Make sure you click Apply, then head back to the survey Builder section.
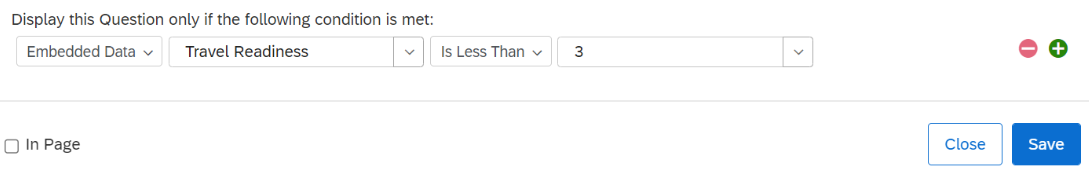
You can now make use of this embedded data in the display logic. For example, go to the response meant for the people who scored between 0 and 2, and add display logic by choosing Display logic from the left hand menu, selecting Embedded Data, Travel Readiness (or whatever name you gave to the embedded data) and then Is Less Than and 3. To add the 3, click on Value and type 3 into the box. The options chosen should look like this:
Do the same thing for the remaining two questions - note that you will need to add two rows of display logic for the second question, indicating that the score needs to be both greater than 2 and less than 6 (or greater than or equal to 3, and less than or equal to 5). To add another line of display logic, click on the green + symbol to the right.
Preview the survey to check that the display logic works as you intended.