Chicago 17th Author-Date
(formerly Chicago 17th B)These instructions for referencing tables and figures are primarily for students completing assignments at Curtin University. They are not intended for those who are publishing their work and making it publicly available (e.g. PhD thesis, journal article, blog, webpage, YouTube video etc.). When publishing and making your work publicly available, written permission to reproduce tables and figures must be obtained from the copyright holder. More information is available from Copyright at Curtin and the Chicago Manual of Style, 17th edition.
What are tables and figures?
- Tables are numerical values or text displayed in rows and columns.
- Figures include all types of illustrations or images (chart, map, graph, photograph, drawing etc.) other than a table.
Why is referencing tables and figures different?
In the Chicago referencing style, an in-text citation and reference list entry provide an appropriate level of acknowledgement to the work of others for most types of materials. However, when adapting or reproducing tables or figures (photographs, illustrations or artworks) you may need to provide additional information and copyright acknowledgement for the work.
Using tables and figures in your assignment
This guide provides different referencing scenarios and additional information to help you acknowledge tables and figures in your assignments appropriately.
Scenario 1: Adapting or reproducing a published table or figure
When you are reproducing (directly copying) or adapting (altered from the original such as changed the layout or presented only some of the data) a table or figure from another source in your work.
Above the table:
- Write the word Table followed by the number and a colon (e.g., Table 1:)
- If you have more than one table in your paper, number them sequentially in the order that they appear in your text (Table 1, Table 2). Numbering is separate for tables and figures
- Give each table a brief explanatory title. The title should be in sentence style capitalisation (where only the first word in the title, the first word in a subtitle, and proper names are capitalised) and have no full stop
Below the table:
- Write the word Source in italics followed by a colon, then write “Table reproduced from” when you have reproduced it or “Table adapted from” when you have adapted it
- Provide the author, year of publication and page number for the source, followed by a full stop.
Reference list:
- Provide a reference list entry for the source (journal article, book, etc.) where you found the table. Follow the instructions in the Chicago referencing guide.
In-text:
- In the text of your assignment, refer to the table by its number. See Assignment example
Example of a table adapted from a journal article
Table 1: Participant information of dog owner interviews about dog walking
| Gender(s) | Age(s) | Dog(s) |
|---|---|---|
| F | 51 | Poodle/spaniel Border Terrier |
| M F |
62 49 |
Alaskan Malamute |
| M F |
69 Unknown |
Labrador |
Source: Table adapted from Westgarth et al. (2017, 3-4).
Below the figure:
- Write the word Figure followed by the number and a full stop (e.g., Figure 1.)
- If you have more than one figure in your paper, number them sequentially in the order that they appear in your text (Figure 1., Figure 2.)
- Give each figure a brief explanatory title. The title should be in sentence style capitalisation (where only the first word of the title, the first word of a subtitle, and proper names are capitalised), and have no full stop
- On the next line, write the word Source in italics followed by a colon, then write “Figure reproduced from” when you have reproduced it (directly copied) or “Figure adapted from” when you have adapted it (altered from the original such as changed the layout or presented only some of the data)
- Provide the author, year of publication, and page number for the source, followed by a full stop.
Reference list:
- Provide a reference list entry for the source (journal article, book, etc.) where you found the figure. Follow the instructions in the Chicago referencing guide.
In-text:
- In the text of your assignment, refer to the table by its number. See Assignment example
Example of a figure reproduced from a published journal article
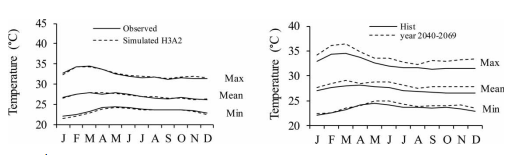
Figure 1. Simulated and projected (years 2040-2069) temperature trend at Alor Setar meteorological station
Source: Figure reproduced from Tukimat and Harun (2015, 653).
For photographs you need to provide the full reference details in a caption presented directly below the figure.
Below the photo:
- Write the word Figure followed by the number and a full stop (e.g. Figure 3.)
- Provide the name of the photographer/creator, followed by a comma
- Provide the title of the photo in italics (use sentence style capitalisation) and then a full stop
- Provide the year of publication and format, separated by a comma
- Write “Reproduced from” followed by a colon and then the source
- State the copyright year and the name of the copyright holder, e.g. Copyright 2018 by Chip Clark, or provide a Creative Commons licence, e.g. CC BY-SA 2.0. See Copyright and Creative Commons for more detail. Add a full stop at the end of the sentence.
Reference list:
- Provide a reference list entry for the source (journal article, book, etc.) where you found the photograph. Follow the instructions in the Chicago referencing guide.
In-text:
- In the text of your assignment, refer to the table by its number. See Assignment example
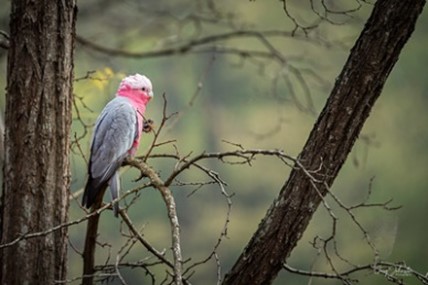
Examples of reproduced photographs
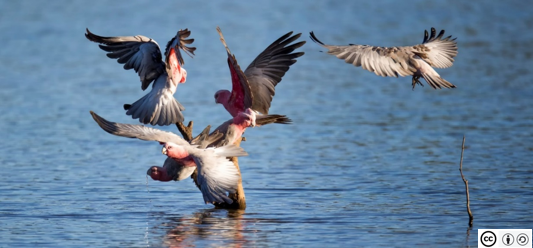
Figure 3. Jim Bendon, Galah 2. 2014, Digital Image. Reproduced from: Flickr. CC BY-SA 2.0.
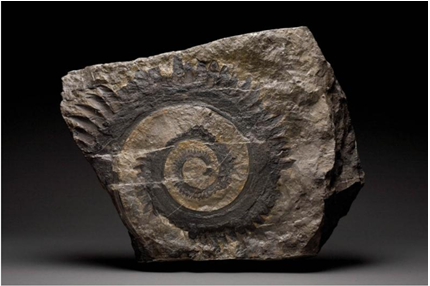
Figure 4. Chip Clark, Fossil tooth whorl of ancient shark. 2018, Digital Image. Reproduced from: Smithsonian Institution. Copyright 2018 by Chip Clark/Smithsonian Institution.
For works of art, you need to provide the full reference details as well as information about the art in a caption provided directly below the figure.
Below the artwork:
- Write the word Figure followed by the number and a full stop (e.g. Figure 5.)
- Provide the name of the creator or artist, followed by a comma
- List the title of the work in italics (use sentence style capitalisation) and then a full stop
- Provide the year the work was created, followed by a comma, then the medium, and another comma
- Include dimensions for the artwork (if available) followed by a full stop
- Provide details of the location of the work (where it is housed) followed by a full stop
- Write “Reproduced from” followed by a colon and then the source
- Where available, state the copyright year and the name of the copyright holder.
Reference list:
- Provide a reference list entry for the source (journal article, book, website etc.) where you found the table. Follow the instructions in the Chicago referencing guide.
In-text:
- In the text of your assignment, refer to the table by its number. See Assignment example
Example of a reproduced artwork
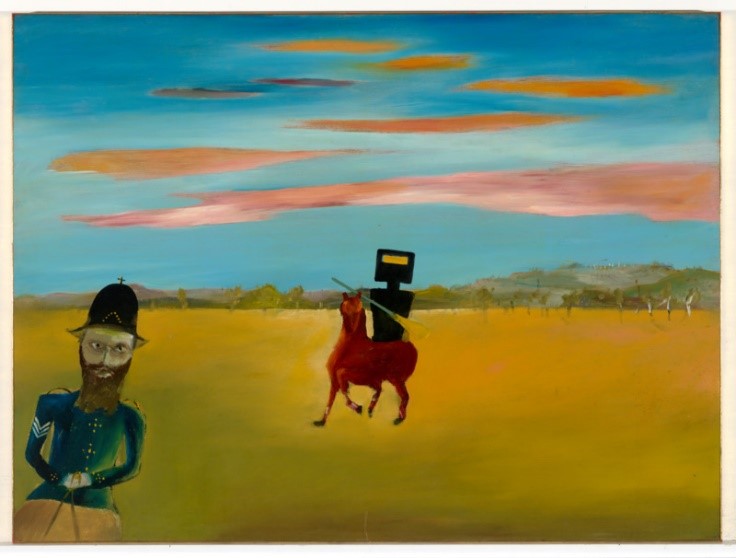
Figure 5. Sidney Nolan, The encounter. 1946, Enamel paint on composition board, 90.4 x 121.2 cm. Canberra: National Gallery of Australia. Reproduced from: National Gallery of Australia.
Scenario 2: Including published tables or figures in a PowerPoint
A PowerPoint presentation has a different purpose from an essay or report but still requires referencing, including acknowledgement of tables and figures adapted or reproduced from another source. Please check with your tutor for specific requirements for referencing in PowerPoints.
On the slide, include the Table number and title above the table and include the source information below the table:
Table 1: Physical development of inland NSW magpies (n=36)
| Age | Weight (g) | Body length (mm) |
|---|---|---|
| 1st week | 50-73 | 51 |
| 2nd week | 100-208 | 76 |
| 3rd week | 220-250 | 89 |
| 4th week | 380 | 104 |
| 3 months | 340-400 | 104 |
Source: Table adapted from Kaplan (2019, 124).
On the slide include the figure number and title below the figure:
Galahs: Background information
- Galahs are members of the Cockatoo family (Birdlife Australia, n.d.)
- Galahs can grow to 35 cm and live to 25 years in the wild (Foundation for National Parks & Wildlife, n.d.)
At the end of your presentation, before the reference list, provide a separate list of figures used in your presentation. This contains the caption information that would usually be included under the figure.
List of Figures
Figure 1. Greg Johnston, Galah. 2019, Digital Image. Reproduced from: Flickr. CC BY-NC-ND 2.0.
Figure 2. Jim Bendon, Galah walking. 2015, Digital Image. Reproduced from: Flickr. CC BY-SA 2.0.
Your PowerPoint should always end with your reference list, detailing all the sources used in your presentation (including tables and figures):
References
Bendon, Jim. 2015. “Galah Walking.” Flickr. https://www.flickr.com/photos/jim_bendon_1957/16207540769/.
BirdLife Australia. n.d. “Galah: Basic Information.” Birds in Backyards. Accessed January 13, 2023. https://www.birdsinbackyards.net/species/Eolophus-roseicapillus.
Foundation for National Parks & Wildlife. n.d. “Galah.” Backyard Buddies. Accessed January 13, 2023. https://www.backyardbuddies.org.au/fact-sheets/Galah.
Johnston, Greg. 2019. “Galah.” Flickr. https://www.flickr.com/photos/gregjohnston/48372512176.
Kaplan, Gisela. 2019. Australian Magpie: Biology and Behaviours of an Unusual Songbird. 2nd ed. Victoria, Australia: CSIRO Publishing. https://ebookcentral.proquest.com/lib/curtin/reader.action?docID=5762566.
Scenario 3: Using your own table or figure
You may wish to include your own photos in an assignment, or you may create a table or figure to present data that you have collected yourself. In this scenario, you will need to include a table or figure number, as well as a descriptive title.
Including your own table
Above the table:
- Write the word Table followed by the number and a colon (e.g. Table 2:)
- If you have more than one table in your paper, number them sequentially in the order that they appear in your text (Table 1, Table 2)
- Give each table a brief explanatory title. The title should be in sentence style capitalisation (where only the first word of the title, the first word of a subtitle, and proper names are capitalised), with no full stop.
Below the table:
- No attribution is required as you have collected the data yourself; however you may want to write ‘Table by Author’ or something similar if omitting the attribution will cause confusion.
Reference list:
- No reference list entry required as you are reporting your own research.
Example of your own table
Table 2: Pet ownership by occupation
| Occupation | Dogs | Cats | Birds |
|---|---|---|---|
| Librarian | 22 | 56 | 9 |
| Accountant | 53 | 29 | 6 |
| Ornithologist | 22 | 0 | 61 |
| Artist | 33 | 33 | 22 |
Including your own figure
Below the figure:
- Write the word Figure, followed by the number and a full stop (e.g. Figure 2.)
- If you have more than one figure in your paper, number them sequentially in the order that they appear in your text (Figure 1, Figure 2)
- Give each figure a brief explanatory title. The title should be in sentence style capitalisation (where only the first word of the title, the first word of a subtitle, and proper names are capitalised), with no full stop
- No attribution is required as it is your own figure; however you may want to write ‘Photograph by Author’ or something similar if omitting the attribution will cause confusion.
Reference list:
- No reference list entry required as you are reporting your own research.
Example of your own figure
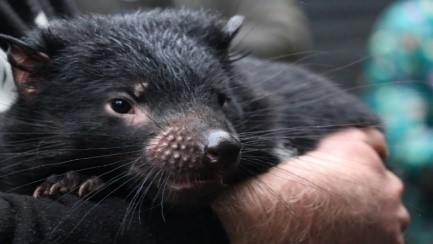
Figure 2. Sleepy Tasmanian Devil in the rain (Photo by Author)
Scenario 4: Using published data to create your own table
When creating your own tables from published data (e.g. with data taken from a report, journal article, book etc.), an in-text citation and reference list entry is usually sufficient acknowledgement of the source material.
Above the table:
- Write the word Table followed by the number and a colon (e.g. Table 3:)
- If you have more than one table in your paper, number them sequentially in the order that they appear in your text (Table 1, Table 2)
- Give each table a brief explanatory title. The title should be in sentence style capitalisation (where only the first word of the title, the first word of a subtitle, and proper names are capitalised), and have no full stop.
Below the table:
- Write the word Source(s) in italics followed by a colon, then write “Data from”
- Provide the name of the author, year of publication and page number for each source used
- If your data comes from more than one source, identify your sources with a superscript letter and separate them with a semi colon.
Reference list
- Provide a reference list entry for the source(s) (journal article, book, etc.) where you found the data. Follow the instructions in the Chicago referencing guide.
In-text:
- In the text of your assignment, refer to the table by its number. See Assignment example
Example of a table created using published data
Table 3: Australian government Indigenous programs and policy locations with Indigenous population by selected states
| State | Number of centresa |
Total Indigenous population |
|---|---|---|
| NSW | 56 | 216,170b |
| WA | 342 | 75,976c |
Sources: Data from a Services Australia (2020); b Australian Bureau of Statistics (2017a, Section: People); c Australian Bureau of Statistics (2017b, Section: People)
If there are no page numbers, add a paragraph number or other identifier to help the reader locate the information, e.g. Section name.
Example incorporating tables and figures into an assignment
Australia’s Indigenous people have a longstanding connection with country, valuing it for a range of cultural, social and economic reasons, in a history that goes back an estimated 60,000 years (Jacobsen, Howell, and Read 2020; Olsen and Russell 2019). Prior to colonisation Australia was comprised of over 250 societies that covered the entire landmass, groups that had their own language, customs and responsibility for managing the land (Karidakis and Kelly 2017). This responsibility has only recently begun to be handed back to Indigenous people with Jacobsen, Howell, and Read (2020) reporting 134 million hectares of land in Australia, 17% of the total landmass, as Indigenous owned. Figure 1 presenting data from the Australian Bureau of Agriculture and Resource Economics and Sciences (ABARES 2020) shows that the bulk of this land is located in central Australia.
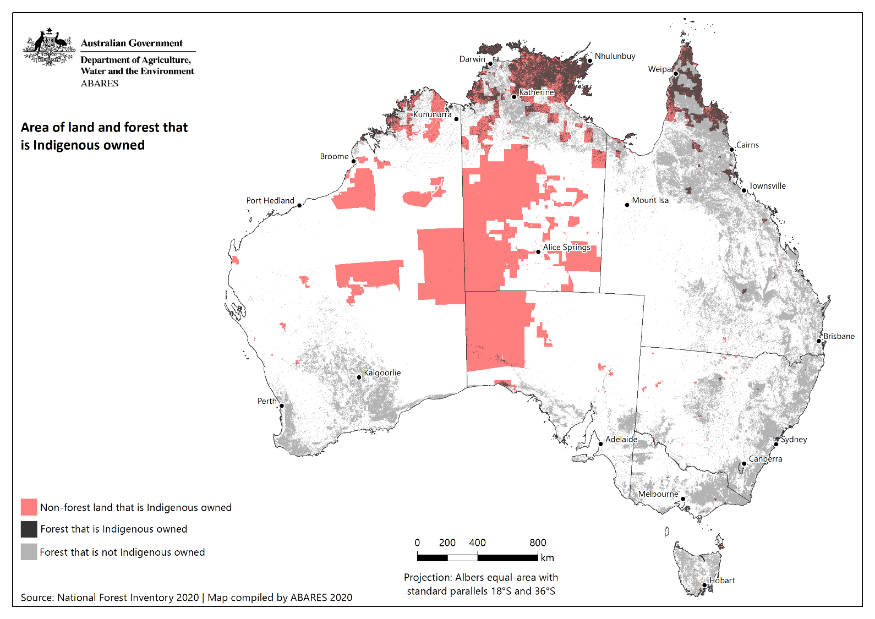
Figure 1. Areas of land and forest that is Indigenous owned
Source: Figure reproduced from Australian Bureau of Agriculture and Resource Economics and Sciences (2020, Map 1). CC-BY 4.0.
Dillon et al. (2015, 6) defines Indigenous land as “all land over which Indigenous people have use and rights as recognised through ownership, management, access or other special rights.” Incorporating these broader definitions, Table 1 breaks down the total area of recognised Indigenous land in Australia.
Table 1: Indigenous land management categories and size (hectares)
| Category | Definitiona | Total areab |
|---|---|---|
| Owned and managed | Lands that are both owned and managed by Indigenous communities | 142,306,000 |
| Managed | Lands that are managed but not owned by Indigenous communities | 32,357,000 |
| Co-managed | Owned and managed by non-Indigenous parties, but agreements guarantee Indigenous people rights in managing land | 28,028,000 |
| Special rights | Lands subject to Native Title determinations and active Indigenous Land Use Agreements | 304,531,000 |
Sources: Data from a Dillon et al. (2015, 9); b Jacobsen, Howell, and Read (2020, 5).
References
Australian Bureau of Agriculture and Resource Economics and Sciences. 2020. “Australia’s Indigenous Forest Estate.” Australian Government. https://data.gov.au/data/dataset/australia-s-indigenous-forest-estate-2020/resource/02e9f3f5-181c-4a71-b4af-70e43d71f28d.
Dillon, Robert, Jeya Jeyasingham, Sid Eades, and Steve Read. 2015. Development of Australia’s Indigenous Forest Estate (2013) Dataset. Research Report 15.6. Canberra: Canberra: Australian Bureau of Agricultural and Resource Economics and Sciences. https://www.agriculture.gov.au/sites/default/files/documents/IndigenousForestEstate_20150828_v1.0.0.pdf.
Jacobsen, Rohan, Claire Howell, and Steve Read. 2020. Australia’s Indigenous Land and Forest Estate: Separate Reporting for Indigenous Ownership, Management and Other Special Rights. Technical Report 20.15. Canberra: Australian Bureau of Agricultural and Resource Economics and Sciences. https://daff.ent.sirsidynix.net.au/client/en_AU/search/asset/1031081/0.
Karidakis, Maria, and Barbara Kelly. 2017. “Trends in Indigenous Language Usage.” Australian Journal of Linguistics 38 (1): 105-126. https://doi.org/10.1080/07268602.2018.1393861.
Olsen, Penny, and Lynette Russell. 2019. “ ‘Civilisation’ Displaces Indigenous Wildlife Balance.” Wildlife Australia 56 (4): 36-41. https://doi.org/10.3316/ielapa.887587290235282.
Copyright and Creative Commons images
Reproducing images
It is important to consider copyright obligations when reusing an image. Don’t assume that a freely accessible image is available to use without permission. This article about copyright infringement illustrates the importance of permission checking before reusing images found on the web.
Many images can be freely downloaded under certain terms and conditions, while websites such as Associated Press, iStock by Getty Images, and Shutterstock require payment for a license to reuse content.
One of the easiest ways to successfully ensure that you are abiding by copyright requirements is to select Open License, Creative Commons (CC) or public domain images.
An Open License is one that grants permission to access, reuse and redistribute work with few or no restrictions. Creative Commons is the most well-known open license system.
A CC license doesn’t replace copyright. CC material is still protected by copyright, but the copyright owners have provided upfront permission for others to reuse their content in particular ways. You don’t have to seek permission from the copyright holder as long as you abide by the conditions set out in the CC license. You can find out more about the various CC licenses through the Creative Commons website.
Public domain images can refer to material in which copyright has expired and can be used without restriction; or where the copyright owner gives very broad permissions to people to use the content freely.
The following websites provide easily accessible advance search filters to quickly identify Creative Commons or public domain images:
- flickr
- Openverse (formerly Creative Commons image search)
- Wikimedia Commons
- The New York Public Library Digital Collections
- State Library of Victoria copyright-free image search (mainly historical images)
- Unsplash
- CSIRO ScienceImage
Sometimes it can be difficult to locate copyright or license information associated with a table or figure. If it’s not presented alongside the content you want to use, do a search of the document for either ‘copyright’ or ‘CC’ using Ctrl + F (command + F on a Mac).
On some websites, you might want to check the footer for a link to ‘Terms of use’ which will provide you with the information you need for copyright acknowledgement.
Reference list
Include a reference list entry for each source used in your assignment, including sources of figures and tables. Below is a list of references used in this tables and figures guide.
References
Australian Bureau of Statistics. 2017a. 2016 Census Aboriginal and/or Torres Strait Islander QuickStats: New South Wales. Canberra, ACT: ABS. https://quickstats.censusdata.abs.gov.au/census_services/getproduct/census/2016/quickstat/IQS5.
Australian Bureau of Statistics. 2017b. 2016 Census Aboriginal and/or Torres Strait Islander QuickStats: Western Australia. Canberra, ACT: ABS. https://quickstats.censusdata.abs.gov.au/census_services/getproduct/census/2016/quickstat/IQS1.
Bendon, Jim. 2015. “Galah Walking.” Flickr. https://www.flickr.com/photos/jim_bendon_1957/16207540769/.
BirdLife Australia. n.d. “Galah: Basic Information.” Birds in Backyards. Accessed January 13, 2023. http://www.birdsinbackyards.net/species/Eolophus-roseicapillus.
Foundation for National Parks & Wildlife. n.d. “Galah.” Backyard Buddies. Accessed January 13, 2023. https://www.backyardbuddies.org.au/fact-sheets/Galah.
Johnston, Greg. 2019. “Galah.” Flickr: https://www.flickr.com/photos/gregjohnston/48372512176.
National Gallery of Australia. n.d. “The Encounter.” National Gallery of Australia. Accessed May 12, 2023. https://searchthecollection.nga.gov.au/results?keyword=the%20encounter&includeParts&hasImages&searchIn=title&searchIn=artistOrCulture.
Services Australia. 2020. “Australian Government Indigenous Programs & Policy Locations (AGIL) Dataset.” Australian Government. https://data.gov.au/data/dataset/34b1c164-fbe8-44a0-84fd-467dba645aa7.
Smithsonian Institution. 2018. “Great White Shark: Carcharodon Carcharias.” Smithsonian Institution. https://ocean.si.edu/ocean-life/sharks-rays/great-white-shark.
Tukimat, Nurul, and Sobri Harun. 2015. “Climate Change Impact on Rainfall and Temperature in Muda Irrigation Area Using Multicorrelation Matrix and Downscaling Method.” Journal of Water and Climate Change 6 (3): 647-660. https://doi.org/10.2166/wcc.2015.015.
Westgarth, Carri, Robert M. Christley, Garry Marvin, and Elizabeth Perkins. 2017. “I Walk My Dog Because It Makes Me Happy: A Qualitative Study to Understand Why Dogs Motivate Walking and Improved Health.” International Journal of Environmental Research and Public Health 14 (8): 936. https://doi.org/10.3390/ijerph14080936.