APA 7th referencing
These guidelines are for students doing assessments at Curtin University. They are not meant for people who are publishing their work and making it available to the public, such as in a PhD thesis, journal article, blog, website, or YouTube video. If you are publishing your work, you must get written permission from the copyright owner before using or copying tables and figures. More information is available from Copyright at Curtin and the Publication Manual of the American Psychological Association, 7th edition.
What are tables and figures?
- Tables are numerical values or text displayed in rows and columns.
- Figures include all types of illustrations or images (chart, map, graph, photograph, drawing etc.) other than a table.
Why is referencing tables and figures different?
Referencing tables and figures is different from referencing other materials in APA style. Normally, you just need an in-text citation and a reference list entry to give credit. However, when you reproduce (copy) or adapt a table or figure from another source, the APA style requires you to provide additional copyright attribution.
Using tables and figures in your assessment
Using a published table or figure
If you are reproducing or adapting a table or figure from another source to use in your assessment, follow these steps:
Above the table or figure
- Write Table or Figure in bold
- If you use more than one table or figure, number them in the order they appear in your work (e.g. Table 1, Table 2). Tables and figures are numbered separately
- One double-spaced line below the label, give the table or figure a short title that explains what it shows. The title should be in italics, with each major word starting with a capital letter and no full stop at the end
Below the table or figure
- Write a caption that explains where the table or figure came from
- Start with Note. in italics. Then write “From” if you copied it exactly, or “Adapted from” if you changed it (for example, by changing the layout or only using part of the data)
- Include the title, author, year it was published, and other source details. See Caption components section
- Say who owns the copyright and what year it was published (e.g. Copyright 2015 by IWA Publishing). If it uses a Creative Commons licence, include that instead (e.g. CC BY-NC). You can find more information in the Copyright and Creative Commons images section
- Double-space the caption.
Reference list
- Add a full reference for the source of the table or figure in your reference list. Follow the APA referencing guide.
In your writing
- Call out (refer) to the table or figure by its number in your writing, e.g. Primary prevention has many intersecting dimensions (Figure 2). OR As shown in Table 1…
Table 1
Participant Information of Dog Owner Interviews about Dog Walking
| Gender(s) | Age(s) | Dog(s) |
|---|---|---|
| F | 51 | Poodle/spaniel Border Terrier |
| M F |
62 49 |
Alaskan Malamute |
| M F |
69 Unknown |
Labrador |
Note. Adapted from “I Walk my Dog Because it Makes me Happy: A Qualitative Study to Understand Why Dogs Motivate Walking and Improved Health,” by C. Westgarth, R. M. Christley, G. Marvin and E. Perkins, 2017, International Journal of Environmental Research and Public Health, 14(8), Article 936 (https://doi.org/10.3390/ijerph14080936). CC BY.
Figure 1
Fossil Tooth Whorl of Ancient Shark
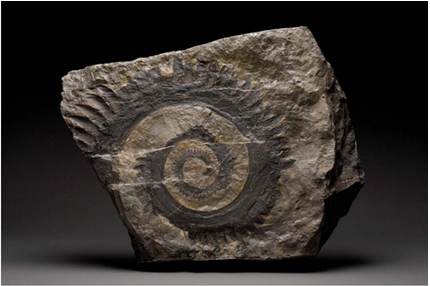
Note. From Great White Shark: Carcharodon Carcharias [Photograph], by Smithsonian Institution, 2018 (https://ocean.si.edu/ocean-life/sharks-rays/great-white-shark). Copyright 2018 by Chip Clark/Smithsonian Institution.
Figure 2
The Ecological Model of Health Promotion/Primary Prevention
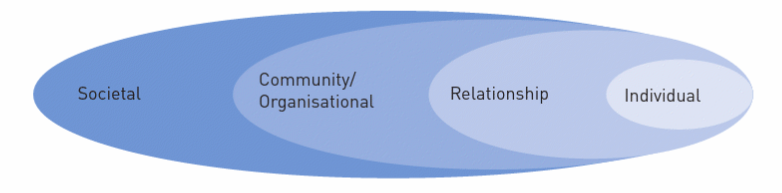
Note. From “Health Promotion,” by H. Keleher, in H. Keleher and C. MacDougall (Eds.), Understanding Health (4th ed., p. 98), 2016, Oxford University Press (https://ebookcentral.proquest.com/lib/curtin/reader.action?docID=4747941). Copyright 2016 by Helen Keleher and Colin MacDougall.
Using tables or figures in PowerPoint
Note: Always check with your tutor if they have specific guidelines for referencing in PowerPoint presentations.
When you include tables or figures in your PowerPoint presentation, you need to show where they came from if they have been adapted or copied from another source. You can choose to put the caption(s):
- On the slide, directly underneath the table or figure OR
- At the end of your presentation, before your reference list (see below instructions).
On the slide where the table or figure appears
- Above the table or figure, write Table or Figure in bold
- If you use more than one table or figure, number them in the order they appear in your work (e.g. Table 1, Table 2). Tables and figures are numbered separately
- One double-spaced line below the label, give the table or figure a short title that explains what it shows. The title should be in italics, with each major word starting with a capital letter and no full stop at the end
Table 1
Physical Development of Inland NSW Magpies (n=36)
| Age | Weight (g) | Body length (mm) |
|---|---|---|
| 1st week | 50-73 | 51 |
| 2nd week | 100-208 | 76 |
| 3rd week | 220-250 | 89 |
| 4th week | 380 | 104 |
| 3 months | 340-400 | 104 |
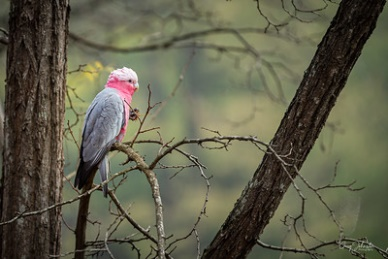
Galahs: Background information
- Galahs are members of the Cockatoo family (Birdlife Australia, n.d.)
- Galahs can grow to 35 cm and live to 25 years in the wild (Foundation for National Parks & Wildlife, n.d.)
Figure 1
Galah Sitting on a Tree Branch
At the end of your presentation
- Before the reference list, include a slide with the caption information (see Caption components section) that would normally appear under the table or figure.
List of tables and figures
Table. Note. Adapted from Australian Magpie: Biology and Behaviours of an Unusual Songbird (p. 124), by G. Kaplan, 2019, CSIRO Publishing (https://ebookcentral.proquest.com/lib/curtin/reader.action?docID=5762566). Copyright 2019 by Gisela Kaplan.
Figure 1. Note. From Galah [Photograph], by G. Johnston, 2019, Flickr (https://www.flickr.com/photos/gregjohnston/48372512176). CC BY-NC-ND 2.0.
Figure 2. Note. From Galah Walking [Photograph], by J. Bendon, 2015, Flickr (https://www.flickr.com/photos/jim_bendon_1957/16207540769/. CC BY-SA 2.0.
Reference list
- Include a reference list with full references for all the sources used in your presentation, following the APA style.
References
Bendon, J. (2015). Galah walking [Photograph]. Flickr. https://www.flickr.com/photos/jim_bendon_1957/16207540769/
BirdLife Australia. (n.d.). Galah: Basic information. Birds in Backyards. http://www.birdsinbackyards.net/species/Eolophus-roseicapillus
Foundation for National Parks & Wildlife. (n.d.). Galah. Backyard Buddies. https://www.backyardbuddies.org.au/fact-sheets/Galah
Johnston, G. (2019). Galah [Photograph]. Flickr. https://www.flickr.com/photos/gregjohnston/48372512176
Kaplan, G. (2019). Australian magpie: Biology and behaviours of an unusual songbird (2nd ed.). CSIRO Publishing. https://ebookcentral.proquest.com/lib/curtin/reader.action?docID=5762566
Using your own table or figure
You may wish to include your own photograph or image in an assessment, or you may create a table or figure from data that you have collected yourself. As you have created the table or figure, there is no need to cite a source but it should still be formatted properly.
Above the table or figure
- Write Table or Figure in bold
- If you use more than one table or figure, number them in the order they appear in your work (e.g. Table 1, Table 2). Tables and figures are numbered separately
- One double-spaced line below the label, give the table or figure a short title that explains what it shows. The title should be in italics, with each major word starting with a capital letter and no full stop at the end
Below the table or figure
- No citation needed (you may wish to add a note to say Photograph by Author or similar if it is not clear that it is your own work)
In your writing
- Call out (refer) to the table or figure by its number in your writing, e.g. As shown in Table 1… OR Primary prevention has many intersecting dimensions (Figure 2).
Figure 1
Sleepy Tasmanian Devil in the Rain
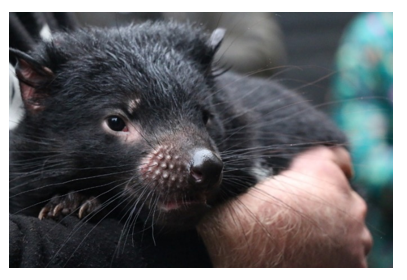
Table 1
Pet Ownership by Occupation
| Dogs | Cats | Birds | |
|---|---|---|---|
| Librarian | 22 | 56 | 9 |
| Accountant | 53 | 29 | 6 |
| Ornithologist | 22 | 0 | 61 |
| Artist | 33 | 33 | 22 |
Using published data to create a table or figure
When you create your own table or figure using data from a published source (e.g. a government report, journal article, or book), an in-text citation and reference list entry is usually sufficient acknowledgement of the source material.
Above the table or figure
- Write Table or Figure in bold
- If you use more than one table or figure, number them in the order they appear in your work (e.g. Table 1, Table 2). Tables and figures are numbered separately
- One double-spaced line below the label, give the table or figure a short title that explains what it shows. The title should be in italics, with each major word starting with a capital letter and no full stop at the end
Within or below the table or figure
- Show where the data came from by adding citations in the table or figure (e.g. next to each row or column) or below it.
In your reference list
- Include a full entry for each source (book, article, website, etc.) in your reference list, following APA style.
In your writing
- Call out (refer) to the table or figure by its number in your writing, e.g. Primary prevention has many intersecting dimensions (Figure 2). OR As shown in Table 1…
Table 1
Australian Government Indigenous Programs and Policy Locations with Indigenous Population by Selected States
| State | Number of centres (Services Australia, 2020) |
Total Indigenous population |
|---|---|---|
| NSW | 56 | 216,170 (Australian Bureau of Statistics [ABS], 2017a) |
| WA | 342 | 75,976 (ABS, 2017b) |
Table 2
Indigenous Land Management Categories and Size (Hectares)
| Category | Definition a | Total area b |
|---|---|---|
| Owned and managed | Lands that are both owned and managed by Indigenous communities | 142,306,000 |
| Managed | Lands that are managed but not owned by Indigenous communities | 32,357,000 |
| Co-managed | Owned and managed by non-Indigenous parties, but agreements guarantee Indigenous people rights in managing land | 28,028,000 |
| Special rights | Lands subject to Native Title determinations and active Indigenous Land Use Agreements | 304,531,000 |
Note. aCategories and definitions per Dillon et al. (2015, p. 9). bArea totals provided in Jacobsen et al. (2020, p. 5).
Caption components
Tips for captions
- Table and figure captions are formatted differently to reference list entries
- When the author and the publisher/source are the same, omit the publisher/source from the caption
- Titles appear in headline capitalisation where each major word starts with a capital letter, e.g. Climate Change in Australia
- Author/editor initials appear before their last name, e.g. P. E. Marik
Caption components
Note in Italics. From [or Adapted from] Title of Book or Report in Italics (p. xxx), by Initial(s). Author Surname and Initial(s). Author Surname, year, Publisher (DOI or URL). Copyright year by Name of Copyright Holder or Creative Commons licence.
Example
Note. From Evidence-Based Critical Care (p. 108), by P. E. Marik, 2015, Springer (https://doi.org/10.1007/978-3-319-11020-2). Copyright 2015 by Springer International Publishing.
Caption components
Note in Italics. From [or Adapted from] “Title of Chapter,” by Initial(s). Author Surname and Initial(s). Author Surname, in Initial(s). Editor Surname (Ed.), Title of Book in Italics (any edition or volume number, p. xxx), year, Publisher (DOI or URL). Copyright year by Name of Copyright Holder or Creative Commons licence.
Example
Note. From “Aboriginal Protest,” by L. Duncan, in G. Foley, A. Schaap and E. Howell (Eds.), The Aboriginal Tent Embassy: Sovereignty, Black Power, Land Rights and the State (p. 62), 2014, Routledge (http://ebookcentral.proquest.com/lib/curtin/reader.action?docID=1323346). Copyright 2014 by Gary Foley, Andrew Schaap and Edwina Howell.
Caption components
Note in Italics. From [or Adapted from] “Title of Article,” by Initial(s). Author Surname and Initial(s). Author Surname, year, Title of Journal in Italics, Volume in Italics(Issue), p. xx (DOI or URL). Copyright year by Name of Copyright Holder or Creative Commons licence.
Example
Note. From “‘Strong Black Women’: African American Women with Disabilities, Intersecting Identities, and Inequality,” by A. L. Miles, 2019, Gender & Society, 33(1), p. 4 (https://doi.org/10.1177/0891243218814820). Copyright 2018 by The Author.
Caption components
Note in Italics. From [or Adapted from] Title of Webpage in Italics, by Initial(s). Author Surname and Initial(s). Author Surname, year, Site Name (URL). Copyright year by Name of Copyright Holder or Creative Commons licence.
Example
Note. From Climate Change in Australia, by CSIRO, 2020 (https://doi.org/10.1177/0891243218814820). Copyright 2020 by Commonwealth Scientific and Industrial Research Organisation.
Example assessment
Australia’s Indigenous people have a longstanding connection with country, valuing it for a range of cultural, social and economic reasons, in a history that goes back an estimated 60,000 years (Jacobsen et al., 2020; Olsen & Russell, 2019). Prior to colonisation, Australia comprised over 250 societies that covered the entire landmass, groups that had their own language, customs and responsibility for managing the land (Karidakis & Kelly, 2017). This responsibility has only recently begun to be handed back to Indigenous people, with Jacobsen et al. (2020) reporting 134 million hectares of land in Australia, 17% of the total landmass, as Indigenous owned. A map produced by the Australian Bureau of Agriculture and Resource Economics and Sciences (ABARES, Figure 1) shows that the bulk of this land is located in central Australia.
Figure 1
Area of Land and Forest that is Indigenous Owned
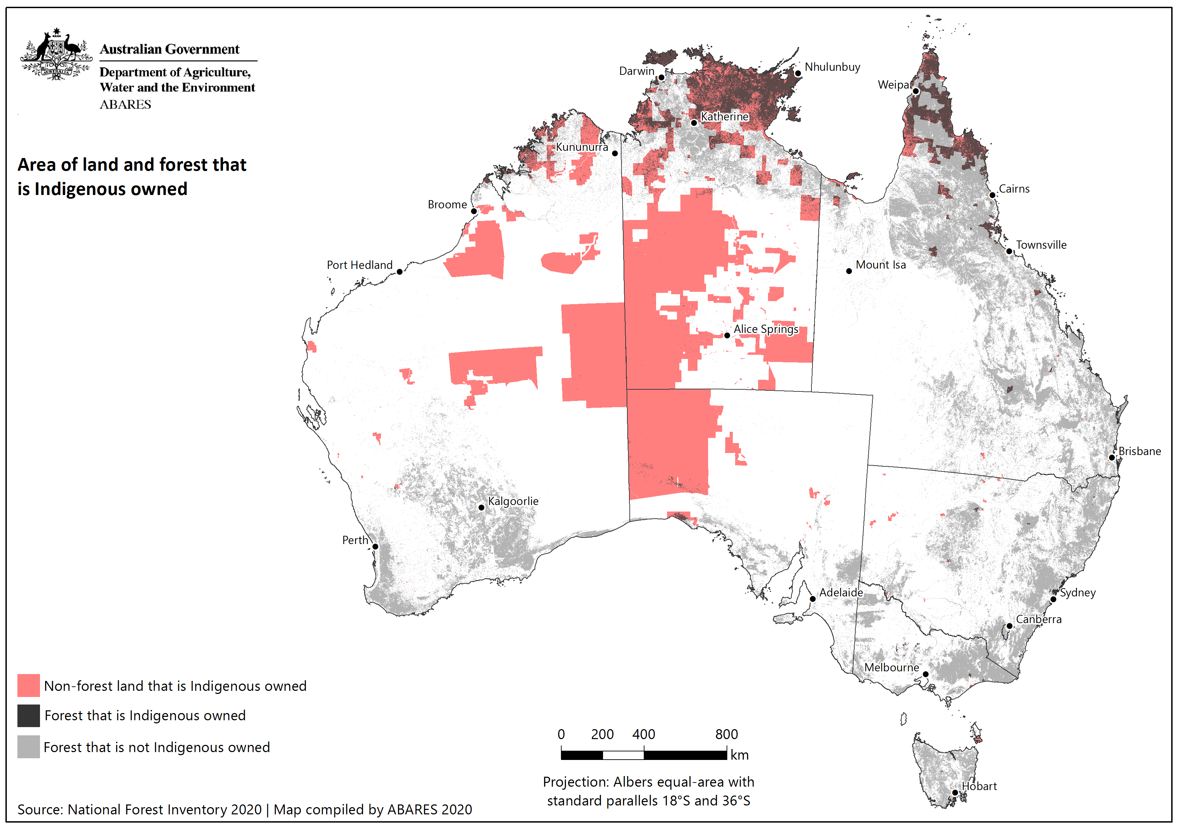
Note. From Australia’s Indigenous Forest Estate, by Australian Bureau of Agriculture and Resource Economics and Sciences, 2020 (https://data.gov.au/data/dataset/australia-s-indigenous-forest-estate-2020). CC BY.
Dillon et al. (2015) defines Indigenous land as “all land over which Indigenous people have use and rights as recognised through ownership, management, access or other special rights” (p. 6). Incorporating these broader definitions, Table 1 breaks down the total area of recognised Indigenous land in Australia.
Table 1
Indigenous Land Management Categories and Size (Hectares)
| Category | Definition a | Total area b |
|---|---|---|
| Owned and managed | Lands that are both owned and managed by Indigenous communities | 142,306,000 |
| Managed | Lands that are managed but not owned by Indigenous communities | 32,357,000 |
| Co-managed | Owned and managed by non-Indigenous parties, but agreements guarantee Indigenous people rights in managing land | 28,028,000 |
| Special rights | Lands subject to Native Title determinations and active Indigenous Land Use Agreements | 304,531,000 |
Note. aCategories and definitions per Dillon et al. (2015, p. 9). bArea totals provided in Jacobsen et al. (2020, p. 5).
References
Australian Bureau of Agriculture and Resource Economics and Sciences. (2020). Australia’s Indigenous forest estate. Australian Government. https://data.gov.au/data/dataset/australia-s-indigenous-forest-estate-2020
Dillon, R., Jeyasingham, J., Eades, S., & Read, S. (2015). Development of Australia’s Indigenous forest estate (2013) dataset (Research Report 15.6). Australian Bureau of Agricultural and Resource Economics and Sciences. https://www.agriculture.gov.au/sites/default/files/documents/IndigenousForestEstate_20150828_v1.0.0.pdf
Jacobsen, R., Howell, C., & Read, S. (2020). Australia’s Indigenous land and forest estate: Separate reporting for Indigenous ownership, management and other special rights. Australian Bureau of Agricultural and Resource Economics and Sciences. https://doi.org/10.25814/bqr0-4m20
Karidakis, M., & Kelly, B. (2017). Trends in Indigenous language usage. Australian Journal of Linguistics, 38(1), 105-126. https://doi.org/10.1080/07268602.2018.1393861
Olsen, P., & Russell, L. (2019). ‘Civilisation’ displaces Indigenous wildlife balance. Wildlife Australia, 56(4), 36-41. https://doi.org/10.3316/ielapa.887587290235282
Copyright and Creative Commons images
Copyright is a law that gives creators (such as writers, artists, musicians) the right to control how their work is used. If you make something original, you automatically own the copyright. Others need your permission to copy, share, or change it. Creative Commons is a system that lets creators share their work more freely. It does not remove copyright, instead it provides licenses that say what others can do with the work—whether they can copy it, change it, or use it for commercial purposes. It is a way to share while still retaining some rights.
To find out more about copyright and Creative Commons, see the Copyright toolkit.
Reproducing images
When you reuse images, it is important to follow copyright rules. Just because an image is easy to find online does not mean you can use it freely. You need to check if you have permission. Some websites let you download images for free, but others—like Shutterstock or Getty Images—require you to pay for a license. A good way to stay within the rules is to use images that have an Open License, are under a Creative Commons (CC) license, or are in the public domain.
An Open License means the creator has given permission for others to use and share the image, often with few restrictions. Creative Commons is a type of open license that tells you how you can use the image without needing to ask for permission. Public domain images are either no longer protected by copyright or have been released by the creator for anyone to use freely.
The following websites provide easily accessible advance search filters to quickly identify Creative Commons or public domain images:
Sometimes it can be difficult to locate copyright or license information associated with a table or figure. If it is not presented alongside the content you want to use, do a search of the document for either ‘copyright’ or ‘CC’ using Ctrl + F (command + F on a Mac).
On some websites, you might want to check the footer for a link to ‘Terms of use’ which will provide you with the information you need for copyright acknowledgement.