Vancouver referencing
These instructions for referencing tables and figures are primarily for students completing assignments at Curtin University. They are not intended for those who are publishing their work and making it publicly available (e.g. PhD thesis, journal article, blog, webpage, YouTube video etc.). When publishing and making your work publicly available, written permission to reproduce tables and figures must be obtained from the copyright holder. More information is available from Copyright at Curtin and the AMA manual of style.
What are tables and figures?
- Tables are numerical values or text displayed in rows and columns.
- Figures are any graphical display used to present information, such as a chart, map, graph, photograph, illustration, digital image, clinical image, etc.
See below for examples of tables and figures.
Adapting or reproducing a published table or figure
When you are adapting (altering from the original) or reproducing (directly copying) a table or figure from another source in your work.
Above the table or figure:
- Write Table or Figure followed by the number and a full stop, in bold (e.g. Table 1. or Figure 1.). Number sequentially according to their order of appearance in the text of your work. If there is only a single table or figure in your paper, label as Table or Figure without the number. Tables and figures are numbered separately.
- Include a brief descriptive title phrase following the table or figure number. The title should be in headline style capitalisation (where each significant word is capitalised) and not in bold.
- Place a line across the width of the table or figure, between the assignment text and the title of the table or figure.
Below the table or figure:
- A legend (if needed) written in sentence format containing information that describes the table or figure beyond the title
- Footnotes may be provided in the legend to give further information about specific data in a table or figure. The order of the footnotes follows their appearance in the table or figure and uses superscript lowercase letters in alphabetical order (a-z) (see Table 2)
- If reproducing a published table or figure, the original source should be cited in the legend with a note to explain the source of the data, e.g. Reproduced from, Adapted from, Data were derived from etc.
- Include any relevant copyright or Creative Commons (CC) licence information, e.g. Reproduced under a CC BY 4.0 licence from Cobiac et al.1
- If the source has specific requirements or terminology for providing acknowledgement, this should be included in the legend
- Citations should be numbered according to their appearance in the text, tables or figures. If you have previously cited a source in the text and cite again in the table or figure, repeat with the same number.
Reference list:
- Include an entry for the source of the table or figure in the reference list.
In text:
- Tables and figures should be placed as close as possible to the text discussing it. Refer to the table or figure by its number, e.g. Figure 1 shows the use of alcohol-based hand rub. OR Use of alcohol-based hand rub is important in surgical settings (Figure 1).
Table 1. Food Tax and Subsidy Interventions
| Intervention | Tax or subsidy | Sources and assumptions |
|---|---|---|
| Saturated fat tax | $1.37/100 g of saturated fat | Tax on saturated fat content in foods with >2.3% saturated fat, excluding drinking milk |
| Excess salt tax | $0.30/1 g of sodium | Tax on sodium in excess of Australian maximum recommended levels, excluding fresh fruits, vegetables, meats, and dairy products |
| Sugar-sweetened beverage tax | $0.47/l | Tax on sugar-sweetened soft drinks, energy drink, cordials, and fruit drinks |
| Fruit and vegetable subsidy | $0.14/100 g | Subsidy on all fresh and preserved fruits and vegetables |
| Sugar tax | $0.94/100 ml of ice cream; $0.85/100 g of sugar | Tax on ice cream containing >10 g of sugar per 100 g of ice cream; tax on sugar content in excess of 10 g per 100 g of all other products, excluding fresh fruits, vegetables, and unflavoured dairy products |
All currency amounts are shown in Australian dollars. Adapted under a CC BY 4.0 licence from Cobiac et al.1
Figure 1. Cultural Safety and Responsiveness Training for Staff
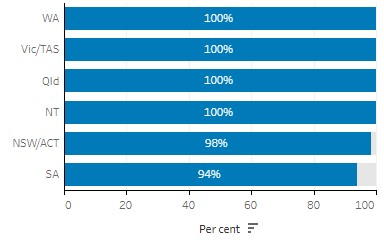
Proportion of Indigenous-specific primary health care organisations and maternal/child health services that had cultural orientation for non-Indigenous staff, by state and territory, 2017-18. Source: Australian Institute of Health and Welfare2 under a CC-BY 3.0 licence.
Note: Source: Australian Institute of Health and Welfare is the acknowledgement required by the licence
Table 2. Australian Workforce Statistics by Health Profession
| Profession | 2013 | 2018 | % change |
|---|---|---|---|
| Allied healtha | 108,680 | 133,388 | 22.7 |
| Dental practitionersb | 17,847 | 20,589 | 15.4 |
| Medical practitioners | 82,408 | 98,395 | 19.4 |
| Nurses and midwives | 295,060 | 333,970 | 13.2 |
Data based on Australian Institute of Health and Welfare3 material under a CC-BY 3.0 licence.
aAllied health professionals include Aboriginal and Torres Strait Islander health practitioners, chiropractors, Chinese medicine practitioners, medical radiation practitioners, occupational therapists, optometrists, osteopaths, pharmacists, physiotherapists, podiatrists and psychologists.
bDental practitioners include oral health therapists, dental hygienists, dental therapists, dental prosthestists and dentists.
Note: To save space, tables with more than a few footnotes can also use two columns for the footnotes
Figure 2. Pocket Bottles Filled with Alcohol-Based Hand Rub for Hand Hygiene in ICUs
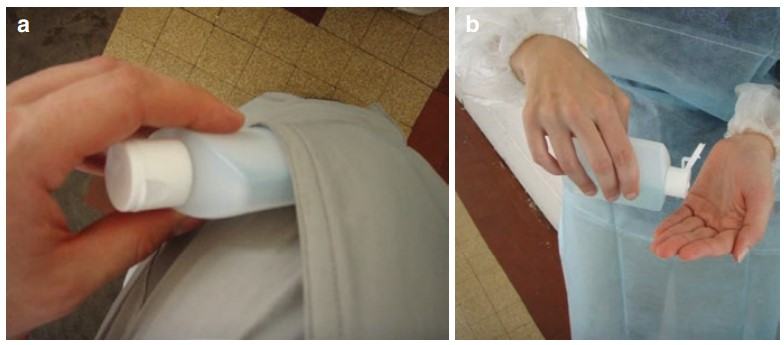
Reproduced from Shultz et al4 under a CC-BY 4.0 licence.
Using published data when creating a table or figure
When creating your own tables and figures from published data (e.g. using data from a report, journal article, book, etc.), a citation and reference list entry is usually sufficient acknowledgement of the source. Depending on how the information is presented, the superscript citation(s) can be included as part of the table or figure, or appear below it. To avoid confusion, superscript citations should not be placed directly after a number in the table or figure, e.g. 216,170 people6 not 216,17066
Above the table or figure:
- Write Table or Figure followed by the number and a full stop, in bold (e.g. Table 1. or Figure 1.). Number sequentially according to their order of appearance in the text of your work. If there is only a single table or figure in your paper, label as Table or Figure without the number. Tables and figures are numbered separately.
- Include a brief descriptive title phrase following the table or figure number. The title should be in headline style capitalisation (where each significant word is capitalised) and not in bold.
- Place a line across the width of the table or figure, between the assignment text and the title of the table or figure.
Below the table or figure:
- A legend (if needed) written in sentence format containing information that describes the table or figure beyond the title
- Footnotes may be provided in the legend to give further information about the specific data in a table or figure. The order of the footnotes follows their appearance in the table or figure and uses superscript lowercase letters in alphabetical order (a-z)
- If a citation and footnote follow the same piece of information, give the citation first, followed by a comma and the footnote letter, e.g. Patient characteristics3,a
- Citations should be numbered according to their appearance in the text, tables or figures. If you have previously cited a source in the text and cite again in the table or figure, repeat with the same number.
Reference list:
- Include a reference list entry for each source cited in the table or figure.
In text:
- Tables and figures should be placed as close as possible to the text discussing it. Refer to the table or figure by its number, e.g. Figure 1 shows the use of alcohol-based hand rub. OR Use of alcohol-based hand rub is important in surgical settings (Figure 1).
Table 3. Indigenous Specific Primary Health Care (PHC) Organisations, by Selected States 2016
| State | No. of Indigenous specific organisations5 | Total Indigenous population |
|---|---|---|
| NSW / ACT | 43 (22% of PHC organisations) | 216,170 people6 |
| WA | 26 (13% of PHC organisations) | 75,976 people7 |
Using your own table or figure
When you have created your own table or figure to present your own research or data.
Above the table or figure:
- Write Table or Figure followed by the number and a full stop, in bold (e.g. Table 1. or Figure 1.). Number sequentially according to their order of appearance in the text of your work. If there is only a single table or figure in your paper then label as Table or Figure without the number. Tables and figures are numbered separately.
- Include a brief descriptive title phrase following the table or figure number. The title should be in headline style capitalisation (where each significant word is capitalised) and not in bold.
- Place a line across the width of the table or figure, between the assignment text and the title of the table or figure.
Below the table or figure:
- A legend (if needed) written in sentence format containing information that describes the table or figure beyond the title
- Footnotes may be provided in the legend to give further information about the specific data in a table or figure. The order of the footnotes follows their appearance in the table or figure and uses superscript lowercase letters in alphabetical order (a-z).
Reference list:
- No reference list entry required as you are reporting your own research.
In text:
- Tables and figures should be placed as close as possible to the text discussing it. Refer to the table or figure by its number, e.g. Figure 1 shows the use of alcohol-based hand rub. OR Use of alcohol-based hand rub is important in surgical settings (Figure 1).
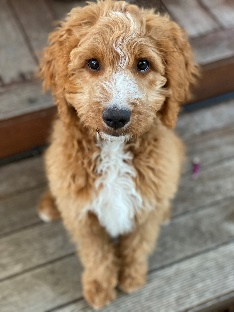
Figure 3. Therapy Dogs Provide Support to Students
Reference list
Include a reference list entry for each source.
REFERENCES
- Cobiac LJ, Tam K, Veerman L, Blakely T. Taxes and subsidies for improving diet and population health in Australia: a cost-effectiveness modelling study. PLoS Med. 2017;14(2):e1002232. doi:10.1371/journal.pmed.1002232
- Australian Institute of Health and Welfare. Cultural Safety in Health Care for Indigenous Australians: Monitoring Framework. Australian Institute of Health and Welfare; 2021. IHW 222. Accessed August 25, 2021. https://www.aihw.gov.au/reports/indigenous-australians/cultural-safety-health-care-framework
- Australian Institute of Health and Welfare. Health workforce. AIHW. July 23, 2020. Updated January 7, 2021. Accessed September 15, 2021. https://www.aihw.gov.au/reports/australias-health/health-workforce
- Shultz MJ, Dunser MW, Dondorp AM. Development of the guidelines: focus on availability, feasibility, affordability, and safety of interventions in resource-limited settings. In: Dondorp AM, Dunser MW, Shultz MJ, eds. Sepsis Management in Resource-Limited Settings. Springer; 2019:25-30. Accessed September 15, 2021. doi:10.1007/978-3-030-03143-5
- Australian Institute of Health and Welfare. Aboriginal and Torres Strait Islander Specific Primary Health Care: Results from the nKPI and OSR Collections. Australian Institute of Health and Welfare; 2021. IHW 227. Accessed September 20, 2021. https://www.aihw.gov.au/reports/indigenous-australians/indigenous-primary-health-care-results-osr-nkpi/what-are-indigenous-specific-primary-health-care-services/organisations
- Australian Bureau of Statistics. 2016 Census: Aboriginal and/or Torres Strait Islander QuickStats: New South Wales. Australian Bureau of Statistics. October 23, 2017. Accessed September 20, 2021. https://quickstats.censusdata.abs.gov.au/census_services/getproduct/census/2016/quickstat/IQS1
- Australian Bureau of Statistics. 2016 Census: Aboriginal and/or Torres Strait Islander QuickStats: Western Australia. Australian Bureau of Statistics. October 23, 2017. Accessed September 20, 2021. https://quickstats.censusdata.abs.gov.au/census_services/getproduct/census/2016/quickstat/IQS5