
Introduction-to-Qualtrics-printable-guide-UniSkills.pdf
Introduction to Qualtrics
Table of Contents
Introduction
Welcome to the Introduction to Qualtrics module. This module provides an introduction to creating and distributing a survey using the online tool Qualtrics. It covers the key features of the software, and uses the example of creating a travel preferences survey to demonstrate concepts. You may wish to work through the module in its entirety and to create this survey, or you may prefer to work through some or all of the different sections as required to customise your own survey.
Your feedback on this module is very welcome and can be provided at any time on the feedback page, or alternatively for any questions about the module please contact Library-UniSkills@curtin.edu.au
Note: if you are having issues with the software itself, such as a problem with accessing surveys or your account, please contact DTS for assistance. </div>
What you will learn
- How to create a new survey in your Qualtrics account, and how to collaborate on a survey.
- How to add, import, edit and renumber questions in a survey, and how to organise them into question blocks as required.
- How to use question behaviour, including display logic and skip logic.
- How to customise a survey by piping words, phrases or values.
- How to customise the end of survey message.
- How to customise the flow of the survey, including through the use of branch logic and embedded data.
- How to edit the look and feel of the survey, including the survey theme, the survey background and other features.
- How to add a back button to a survey, how to add scoring, how to set up quotas and how to provide multiple language options.
- How to publish and distribute a survey.
The PDF below is a printable version of this guide, which you can download and refer to later.
- Introduction to Qualtrics [PDF, 1336kB] Getting started
You will need to access Qualtrics differently depending on your role and how you intend to use it.
Academic staff and Students
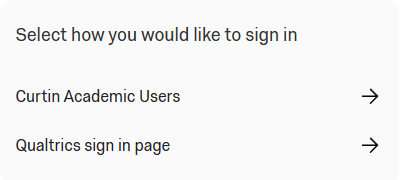
If you are conducting academic surveys, access Qualtrics via the Academic Users page and select “Curtin Academic Users” from the sign-in selection screen:
Non‑academic staff
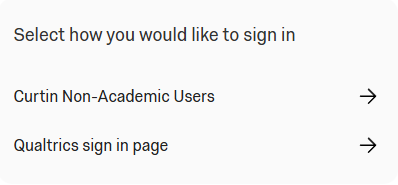
If you are conducting non‑academic surveys (for example marketing, events, engagement, or operational surveys), access Qualtrics via the Non-Academic Users page and select “Curtin Non-Academic Users” from the sign-in selection screen:
If you are unsure which category your survey falls under, please log a request with DTS for assessment and guidance.
Once you have logged into your account you can get started working on a survey, as detailed in this page.
In brief, it covers the following:
- How to create a new survey, either from scratch or by using a guided project or template
- How to collaborate on a survey with others
</div>
Creating a new survey
To create a new project, select the Create a new project button on the bottom-left corner of the screen. You will then be presented with a few different options for your project:
- Guided projects are pre-built projects, with step-by-step instructions
- Sample projects are sample surveys and data you can use to test things out
- Project templates are templates relating to different subject matter
- Academic project templates are education specific, pre-built templates
There’s also an option to start a project From scratch. Under this heading there are two options, Survey and Imported Data. The survey option allows you create a survey, while the imported data option allows you to import data from outside the Qualtrics site and analyse it.
To create a new survey from scratch, underneath From scratch choose Survey and select Get started from the bottom right hand corner. You will then be prompted to give your survey a name, and to select which folder to store it in (if relevant). You can also choose how you would like to start the survey. These options include:
- Create a blank survey project which allows you to create a survey completely from scratch.
- Import a QSF file which allows you to import a ‘Qualtrics Survey Format’ file from another Qualtrics account.
- Copy a survey from an existing project
- Use a survey from your library
Example To create a test survey for use with this module, name the survey Test survey. Save it in the default Projects and Programs folder (or choose another folder if wished), choose Create a blank survey project and then select Create project.
Collaborating on a survey
Another option is to work on a survey that has already been created by someone else. In order to do this, they will need to add you as a collaborator. Once they have done this, their survey should be displayed in your list of projects (open the Projects page and select Shared with me from the left hand menu to more easily locate any projects that have been shared with you, if required). Once you have access to the project, simply select the project to open it and work on it.
Alternatively, if you would like to share a project with someone else you will first need to locate the project in your list of projects. Once you have done this, click on the three dots to the right of the project name and choose Collaborate, then search for the person using their name or staff or student ID. Once you have found them click Add Selected, then select Invite (add an optional custom message first, if you like).
Survey builder
The survey Builder will open automatically when you create a new project or select an existing one. It is used to create and edit your survey. When you leave this section later you can navigate back to it using the top icon in the menu on the left. The icon looks like a clipboard:

This page details the key functionality available in this section of Qualtrics.
In brief, it covers how to do the following:
- Add different types of questions to a survey
- Import questions from the Qualtrics library or from another survey
- Edit questions in a survey
- Renumber questions in a survey
- Organise survey questions into question blocks
- Add question behaviour to survey questions, including display logic and skip logic
- Customise the survey by piping text
- Customise the end of survey message
</div>
Adding survey questions
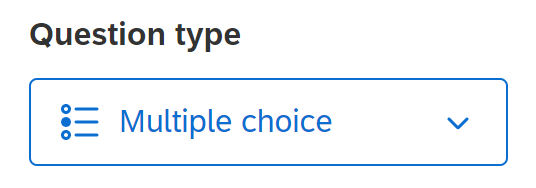
Each blank survey starts off with a blank Multiple choice question in the Default question block (see Question blocks for more information on these). You can change the type of this question by selecting it and choosing from the available question types using the Question type drop down list in the Edit question menu at the left of the screen:
Similarly, when you select Add new question you can choose from the list of available question types, and again you can always change this later. When using the Curtin Qualtrics licence, there is a large range of question types to choose from, as listed below. To learn more about a question type, click on the option you’d like to know more about:
- Multiple choice
- Text entry
- Text/Graphic
- Matrix table
- Slider
- Form field
- Rank order
- Side by side
- Net promoter score
- Timing
- Graphic slider
- Constant sum
- File upload
- Pick, group and rank
- Drill down
- Signature
- Heat map
- Hot spot
- Meta info
- Captcha verification
- Highlight
Example
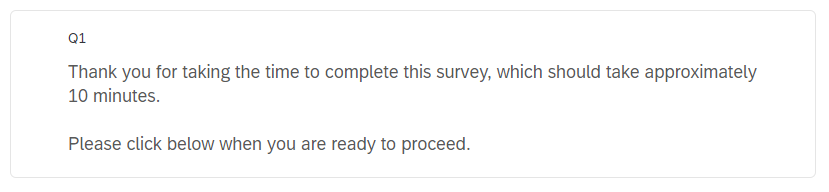
Change the blank Multiple choice question in the Test survey to the Text/Graphic question type using the Question type drop-down list in the Edit question menu. Then write a brief introduction to the survey, which in this case could look something like the following:
Next let’s add a couple of demographic questions. First, click the Add new question button below the introductory text and select the Text entry question type. Then write a question asking for the participant’s postcode. If you like, you can also adjust the size of the text box by hovering over the right hand side of the box and clicking and dragging the edge to make it smaller. (Note that another option would be to use the Form field question type for this. However, this question type is usually used when more than one text box is required - for example, to capture different fields of a participant’s address.)
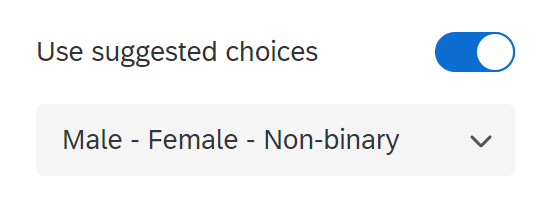
To add another question click the Add new question button below the postcode question, and this time select the Multiple choice question type. Write a question asking which gender the participant identifies as. After you do this, you will see that the choice options are populated with suggested choices. You can still edit, add or remove choices when using suggested choices, or you can select a different suggested choice (if relevant) from the Edit question menu at the left of screen. You can also use this menu to toggle on and choose from suggested choices if they don’t automatically appear.
Importing survey questions
In addition to the Add new question option, there is also the option to Import from library. This allows you to import a question either from the Qualtrics Library (which has a range of surveys and questions to choose from, including common demographic questions) or from any other survey you have previously created or had shared with you. It can save you a lot of time re-writing questions!

Editing questions
You can perform various question actions using the menu that appears when you select the three dots at the top-right corner of the relevant question. This menu provides options such as moving the question (which you can also do by dragging and dropping), copying the question, replacing the question with one from the library, adding a page break, deleting the question and previewing the question (which allows you to see what the question will look like to participants). Note that you can also add a page break by hovering below the question and selecting + Add a page break.
Additionally, you can make edits to a question by selecting it and choosing from the options that appear on the Edit question menu to the left of screen. These options vary according to the question type, but may include choosing the text type (e.g. single or multiple lines), allowing multiple answers, changing the number of choices, changing the formatting of the choices, adding requirements (such as forcing or requesting a response), adding validation, and adding question behaviour, as detailed below.
Example
In the Test survey, click the three dots to display the menu for the first question (the question where you have provided instructions). Then select Add page break to add a page break below it, so that these instructions appear on their own page.
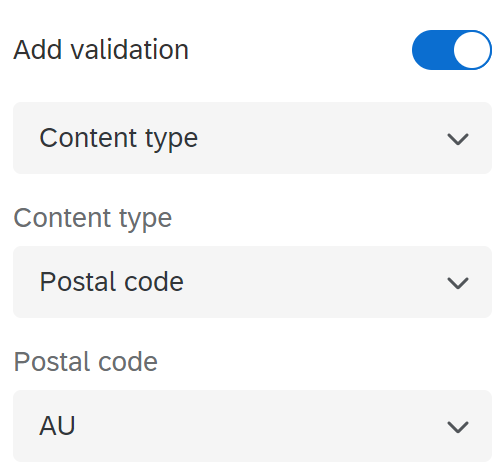
Next, let’s add some validation to the second question (the postcode question) to ensure the participant enters a valid postcode. To do this, click on the question and then use the Edit question menu on the left of screen to toggle on Add validation. Change ‘Minimum length’ to Content type using the drop-down menu, then choose Postal code from the new Content type drop-down menu, and AU from the new Postal code drop-down menu, as shown below:
So far, your Test survey questions might look like the following in the survey builder:
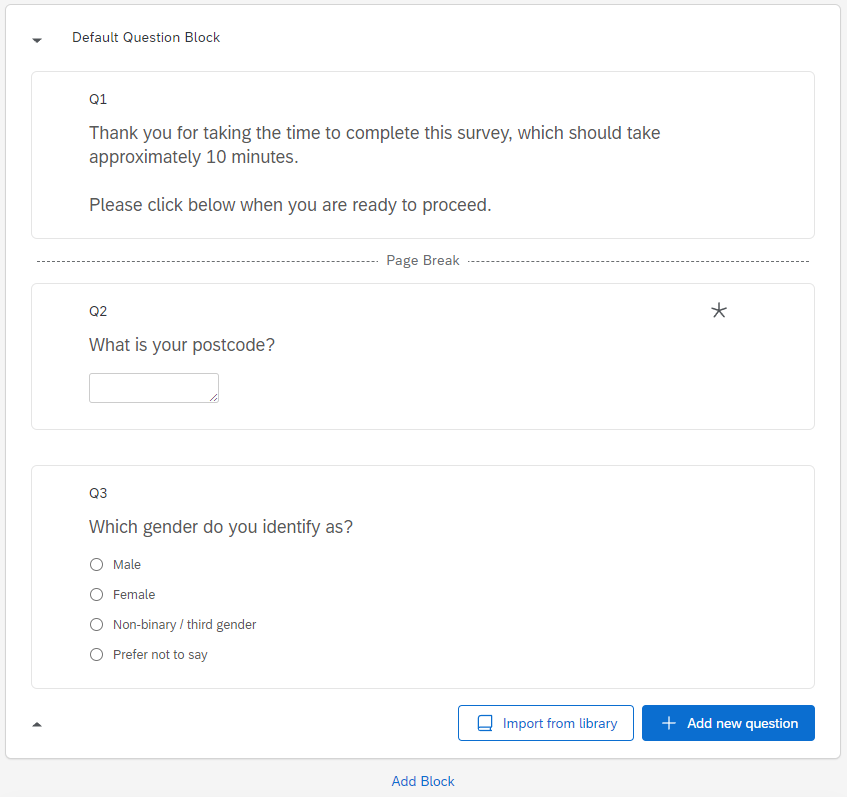
You can also click the Preview button in the top-right to check that things will display as you expect for participants.
Renumbering questions
As you go about adding questions, you may notice that they are numbered in the order they are created, rather than the order in which they appear in the survey – meaning that if you add and then delete a question, or move questions around, the numbering will get mixed up.
The question numbers are not visible to participants (unless you make them visible through the Survey options) so it is not a problem in that respect, but if you would like to have the questions numbered in the correct order for organisational purposes, note that you can change a question number by clicking on it and editing.
Alternatively, you can automatically re-number questions at any time by selecting the Tools drop-down menu at the top of the survey, choosing Auto-number questions and selecting the type of numbering you wish to use.
Question blocks
Qualtrics surveys are organised into ‘blocks’ of questions, and each blank survey starts off with one Default Question Block. You can change the name of this block to a more meaningful name by clicking on it and typing (note that these names are not visible to survey participants though).
For a simple survey it is fine to just have one block of questions, but you may like to group questions in a longer survey into blocks – both for your organisational purposes, and so that the participant views them on separate pages (alternatively, you can add page breaks between questions in the same block to have them display on separate pages for the participant – see Editing questions). Another reason to use multiple blocks would be to customise the flow of your survey to do different things with different blocks of questions (see the Survey flow page of this module).
If you do want to add more question blocks to your survey you can do so by selecting the Add Block button, and you can reorganise any blocks you have created by selecting and dragging them to the appropriate spot in your survey. Alternatively, you can also perform these actions through the block menu, which you can view by selecting the three dots at the top right corner of the relevant block. This menu also provides options including Copy, Delete, Collapse questions (so you only see the questions, not any answer choices, in the survey builder) and Preview block.
You can also make other edits to the block by selecting it (make sure you select the block itself rather than a question within it) and choosing from the options that appear on the Edit block menu at the left of screen. Options provided here are Question randomisation and Loop & merge as well as Next/Previous button text. The latter allows you to enter text that will appear on any ‘Next’ or ‘Previous’ buttons in the selected block (to learn how to add a back button to your survey see Survey options). Note that if your survey contains multiple blocks and you would like them all to have the same ‘Next’ and/or ‘Previous’ text, it is recommended that you make this change for all blocks at once as detailed on the Look & feel page of this module instead.
Example
Click on the name of the block in your Test survey and type in Demographics to change its name.
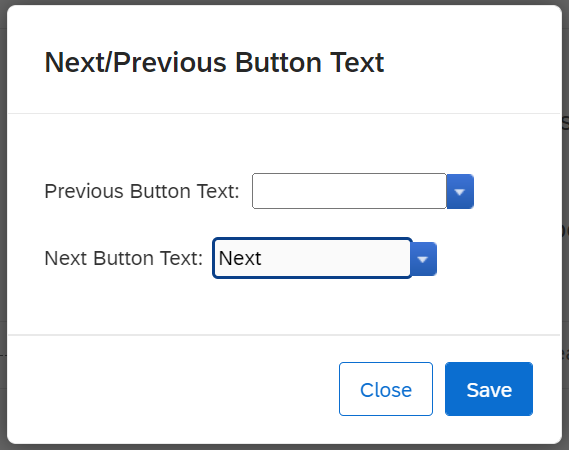
Select the block then click on Next/previous button text in the Edit block menu on the left of screen. Format the ‘Next/Previous button text’ so that the Next button reads Next for this block, as shown.
Finally, add another block below the ‘Demographics’ block by clicking on Add Block, then name the new block Travel Choices.
Question behaviour
You have the option to add different types of behaviour to each question you create in a survey. While this isn’t essential, and may not be required for a simple survey, you will often find that adding question behaviour helps to customise and improve your survey. For example, you could use a behaviour called Display logic to only display a question when a certain condition is met, and/or you could use a behaviour called Skip logic to skip the participant ahead to a future point in the survey based on their response to a question.
To edit the Question behaviour of a question, select a question you wish to edit and then choose the behaviour from the bottom of the Edit question menu at the left of screen.
The following sections provide more information and some examples for Display logic and Skip logic. Alternatively, to find out more about other types of question behaviour (noting that not all are available for each question type) click on the relevant link to view information on the Qualtrics support site:
Display logic
Display logic is used when you only want to display a question, or to display certain answers to a question, when a specified condition or conditions are met. The condition or conditions you set could be based on a number of things, but most often these are related to question responses, embedded data and quotas. While you can use display logic on any number of questions, note that if you want to skip the participant past a series of questions or to the end of a block or end of the survey, it will be more efficient to use Skip logic instead. Alternatively, if you want to conditionally display one or more blocks of questions it will be more efficient to use Branch logic instead.
To add display logic to a question, select the question you want to apply the logic to and then choose Display logic from the bottom of the Edit question menu at the left of screen. Alternatively, to apply display logic to part of a question (for example a choice for a Multiple choice question or statement for a Matrix table question), select the relevant part of the question and then use the drop-down menu to select Add Display Logic… Next, specify what you would like the logic to be based on (for example a Question, Embedded Data or a Quota), then make further selections as relevant. Note that you can add multiple conditions by pressing the + sign, and that you can choose to have a question displayed on the same page as previous question(s) by selecting the In Page option.
Further information can also be found on the Display Logic page of the Qualtrics support site.
Example
Let’s apply display logic to the Test survey, to allow us to conditionally display a question asking how many of the participant’s children are aged under 18. This question will only display if the participant answers yes to a previous question asking whether or not they have any children.
To do this, first add the question asking whether or not the participant has children, by clicking on the Add new question button, selecting the Multiple choice question type and then writing the question. The choice options will be populated with suggested choices, and you can reduce these to the required Yes and No options by reducing the Number of choices to 2 (in the Edit question menu at the left of screen). You may also like to select the Reverse order box (also in the Edit question menu at the left of screen) so that the ‘Yes’ response is listed first, if preferred.
Next, click the Add new question button again and add another Multiple choice question asking how many of the participant’s children are aged under 18. Enter five choices for this question: 0, 1, 2, 3 and 4 or more. This question should only display if the participant has previously indicated that they have children, so to enable this select the question and choose Display logic from the Edit question menu at the left of screen.
Now specify the condition that needs to be true in order for the question to display. To do this, keep the first drop-down box as Question and then select the Do you have any children? question in the second box. Choose Yes and Is Selected in the following boxes. Additionally, tick the In Page box so that the question appears on the same page as the previous question when the participant views the survey. Finally, select Save. Your ‘Display logic’ options should look like this:
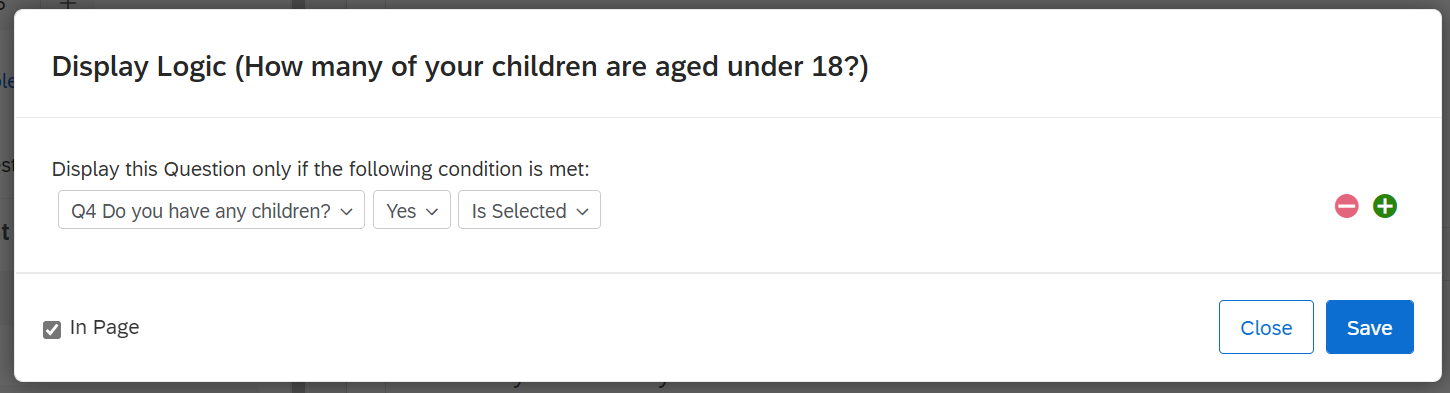
If you preview the survey, you should see that the number of children question only appears when you answer ‘Yes’ to having children.
Skip logic
Skip logic enables you to skip the participant to a later part of the survey based on their response to a question. Participants can be skipped ahead to a question in the current block, to the end of the current block, or to the end of the survey. Depending on what exactly you’d like to do, sometimes you might find that you also need to use Branch logic or Display logic after skipping the participant to the end of a block, in order to navigate them to a particular place in the survey.
Further information can also be found on the Skip Logic page of the Qualtrics support site.
Example
Suppose that you would like to start your Test survey with a question that asks the participant whether or not they are willing to provide demographic information. If they are, they will proceed to the next question as normal. If not, they will be skipped to the end of the ‘Demographics’ block. To do this, first click on the Add new question button, then select the Multiple choice question type and write a question asking the participant if they are happy to answer some demographic questions, with Yes or No response options.
Either select and drag the question or use the Move question option in the question menu (accessible by selecting the three dots at the top-right corner of the question) to move the question so that it sits below the first question’s page break, above the question asking for their postcode, then click to + Add a page break below it as well. Note that you can also use the Auto-number questions feature in the Tools drop-down menu at the top of the page to automatically re-number the questions at this point if desired.
To add skip logic to this new question, select the question and choose Skip logic from the Edit question menu at the left of screen. Now specify where the participant should be skipped to and when, by choosing End of Block in the first menu, if No Is Selected. Press Confirm. Your skip logic should look like this:
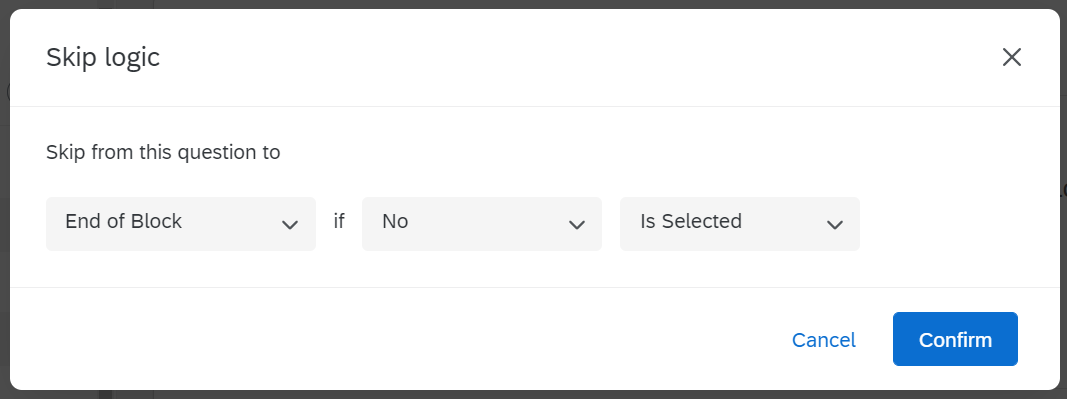
If you preview the survey, you should be skipped to the end of the ‘Demographics’ block (which is currently the end of the survey as there are no further questions) if you answer ‘No’ to the question about demographics.
Piped text
Piped text allows you to customise your survey to include words, phrases or values that have been sourced from various places – such as a participant’s response to a question or their score (see Scoring for information about scoring). To add piped text, click on a question as though you were editing the text and then select the Piped Text… tab. You can then choose where you would like to pipe from and which text you would like to pipe.
Example
Let’s ask the participant where they would most like to go on holiday, then use their answer in a follow up question to ask about their choice. To do this, first click on the Add new question button, then select the Text entry question type and write a question asking the participant where they would most like to go on holiday. You may like to force a response to this question, to ensure you receive an answer, by toggling on Add requirements and keeping Force response selected (in the Edit question menu at the left of screen). Next, click on the Add new question button and select the Text entry question type again, then click to + Add a page break between the two questions.
The second question will ask what appeals to the participant most about their selected holiday destination, using piped text to include the name of the destination specified in response to the previous question. To do this, type the first portion of the question (e.g. ‘What appeals to you most about’), then when the piped text from the previous question’s answer is required select the Piped Text… tab and choose Survey Question. Navigate to the question asking where they would like to go on holiday, and then select it again. Finally, add a question mark after the piped text to complete the question. The questions in the Travel Choices block should now look like the following (note that the question ID may be different in your piped text):
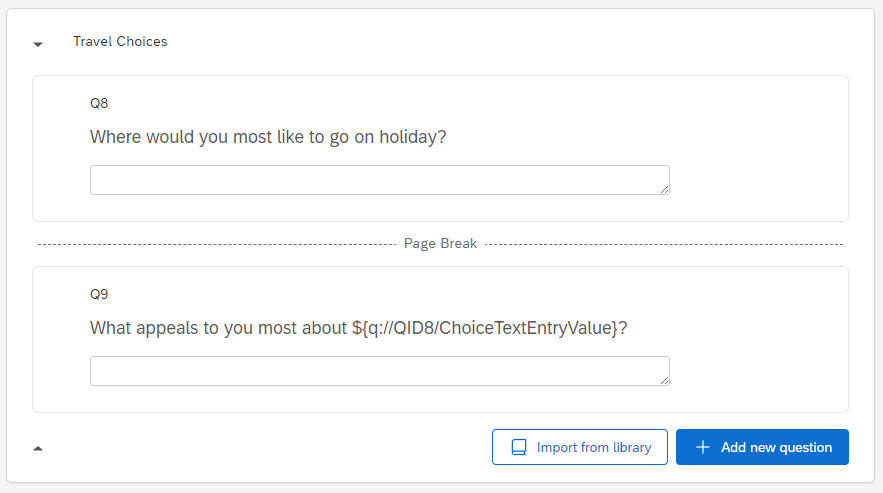
Preview the survey to check that this has worked correctly, or alternatively just preview the ‘Travel choices’ block by choosing the Preview block option from the block menu (accessible by selecting the three dots at the top-right corner of the block).
End of survey message
The default message that participants will see when they finish completing a survey is as follows:

Sometimes you may wish to change this though, to provide a customised message, to redirect to a URL, or to include a response summary. You can do this by selecting the End of Survey block, then changing the End of survey message from Default in the Edit end of survey menu at the left of screen. If you choose to add a custom message you can load a saved message from your message library, or you can scroll down past any existing messages and select New Message to create a new one.
If you want to make edits to a custom message you will first need to choose Library from the drop-down menu at the top of the screen (to the left of the survey title):
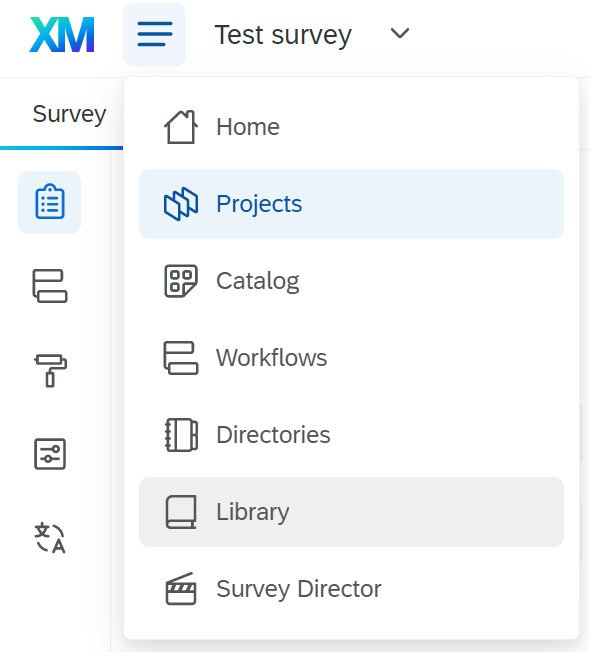
Next, choose Messages Library from the tabs at the top, select the message that you want to edit, select Edit, make the required changes and then press Save. When you are finished, navigate back to the project by selecting Projects from the drop-down menu at the top of the screen (the one used previously) and choosing the appropriate project.
If you wish to provide the participant with a summary of their responses, you should select Include response summary from the End of survey message menu instead. Participants can then download their responses as a PDF if wished.
Example Let’s change the end of survey message in the Test survey to a custom message. To do this, select the End of Survey block and choose Custom message from the End of survey message menu at the left of screen. Choose My Library from the Load a saved message drop-down box, then select New message. Type a description, for example ‘Test survey end message’, then type a customised message and press ‘Save’.
Survey flow
The Survey flow section of Qualtrics allows you to view the block or blocks of questions in your survey, and to add in other elements. If you only have one block of questions you won’t need to make use of this section, but for surveys with more than one block it allows the blocks to be easily rearranged, and for the survey flow to be customised – such as through branching logic.
To access the survey flow section of Qualtrics, click on the ‘Survey flow’ icon on the navigation menu at the far left of the screen:

This page details some of the functionality available in this section of Qualtrics.
In brief, it covers how to do the following:
- Edit the survey flow
- Add branch logic to a survey
- Add embedded data to a survey
</div>
Editing the survey flow
In the survey flow section of Qualtrics you will see the question blocks that currently appear in the survey, and can add new blocks, move blocks, duplicate and delete blocks as desired. You can also add in other elements by clicking Add Below or + Add a New Element Here, both of which will display a list of options:

Aside from blocks, the most commonly used of these elements are typically Branch and Embedded Data, and these are detailed in the following sections. Alternatively, to find out more about other elements click on the relevant link to view information on the Qualtrics support site:
Branch logic
Branch logic is used to conditionally display blocks of questions (or other survey elements) based on information such as question responses. It allows you to customise the flow of your survey to best suit the respondent. You can do this in the Survey flow section of Qualtrics by selecting Add Below or + Add a New Element Here, selecting Branch, selecting Add a Condition and specifying a condition based on a question, embedded data or other option. You can then add or move other blocks or elements below this branch, so that they will only be reached if the specified condition is met. You will then need to select Apply to save any such changes before leaving the Survey flow section.
Example
Let’s customise the Test survey by asking the participant whether or not they have ever previously visited their chosen holiday destination, and directing them to different blocks of questions accordingly.
To do this, first return to the survey Builder and add a new multiple choice question to the ‘Travel Choices’ block which asks the participant whether they have visited their chosen holiday destination before (use piped text, as detailed in the Survey builder page, to include the name of the destination in the question). Include Yes or No response options, and force a response to this question by toggling on Add requirements and keeping Force response selected (on the Edit question menu on the left of screen), if you want to ensure the participant follows one of the branching options. Alternatively, if you don’t force a response then the participant will just be taken to the next block after the branching blocks (or to the end of the survey if there are no other blocks) if they don’t answer the question.
Now add a new block below the ‘Travel Choices’ block by selecting Add Block, and rename it Visited Before. Add at least one multiple choice question, with relevant answer options, to this block; for example, asking how many times the participant has been to their selected holiday destination and how long ago they last visited (use piped text to display the name of the destination in the questions again).
Similarly, add another block below this one called Haven’t Visited Before, and add some ‘Multiple Choice’ questions with relevant answer options; for example asking whether they know anyone who has been to their selected holiday destination, and whether they plan to visit there in the next year. If desired, re-number all questions at this point by selecting the Tools drop down menu at the top of the survey, choosing Auto-number questions and selecting the type of numbering you wish to use.
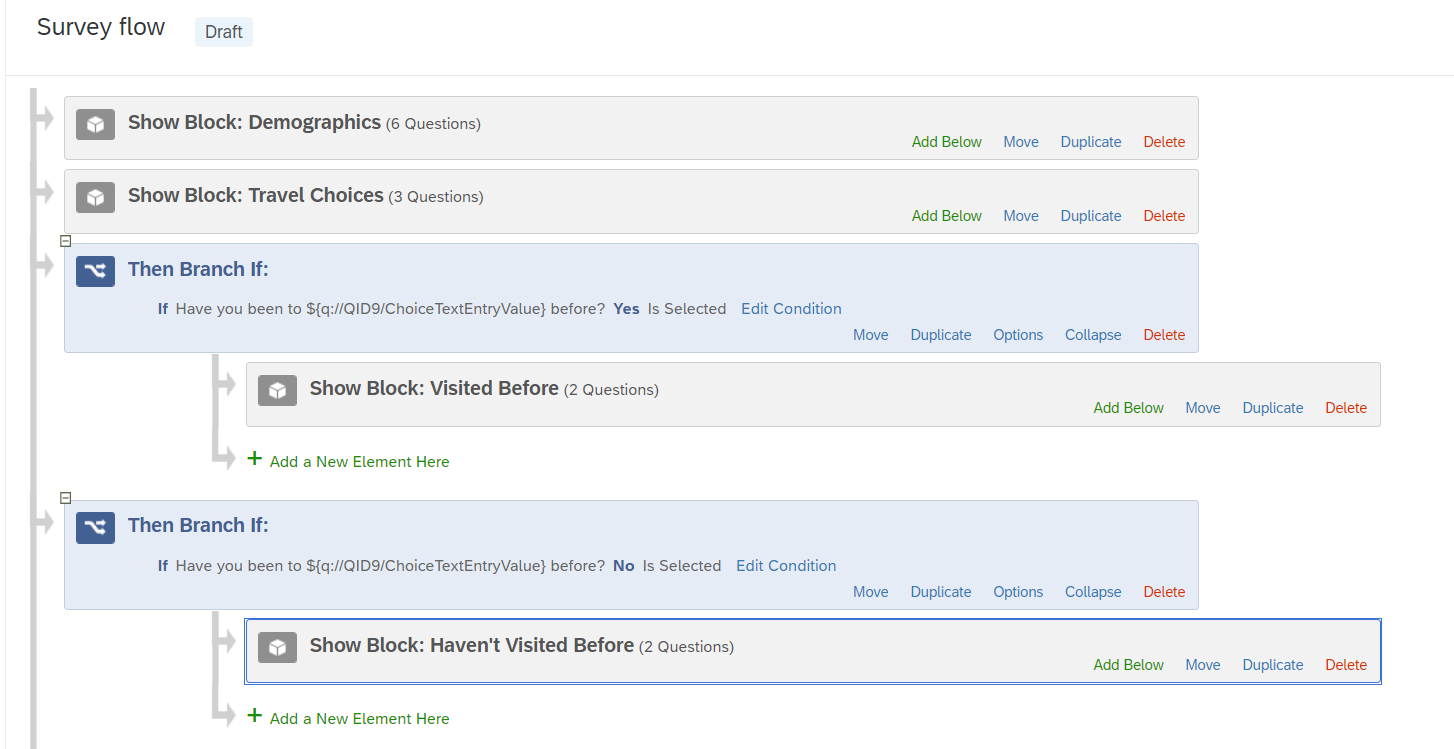
Next go to Survey flow and add a branch below the ‘Travel Choices’ block, by choosing Add Below and selecting Branch. Repeat the process to add another branch directly above the first one. Select Add a Condition on the top branch and then set up the required condition by selecting the relevant question (i.e. the one asking whether they have visited the destination before), selecting Yes and Is Selected. Click OK, then select Move on the ‘Visited Before’ block and drag it to sit below the top branch.
Finally, click Add a Condition on the bottom branch and then set up the required condition by selecting the relevant question (i.e. the one asking whether they have visited the destination before), selecting No and Is Selected. Click OK, then select Move on the ‘Haven’t Visited Before’ block, and drag it to sit below the bottom branch.
Select Apply to save the changes. The survey flow should look as follows:
Go back to the survey builder and preview the survey to check that it works as expected.
Note that further information can also be found on the Branch Logic page of the Qualtrics support site if required.
Embedded data
Embedded data allows you to record extra information in your survey, in addition to the participant’s responses. For example, you could use embedded data to store information that is saved in a contact list or to record a participant’s score (for more information on contact lists, see the Distributing your survey page of this module).
You can add embedded data in the Survey flow section of Qualtrics by selecting Add Below or + Add a New Element Here, then selecting Embedded Data. You then need to assign both a name (referred to as a field) and a value to the embedded data. To assign a name click on Create New Field or Choose From Dropdown…, then either choose the name from the drop down menu or type your chosen name in the box. You will then need to set the value of the embedded data by clicking the blue Set a Value Now text, then either entering a custom value or selecting Insert piped text from the drop down menu and choosing where to pipe the value from.
Once you have added embedded data to your survey you can use it in a few different ways, including as piped text and as part of branch logic or display logic. For an example of creating embedded data to record a participant’s score and then using it as part of display logic, see the Scoring section of the Survey options page of this module.
Note that further information can also be found on the Embedded Data page of the Qualtrics support site if required.
Look & feel
The Look and feel section of Qualtrics allows you to customise the look of your survey – changing the theme and adjusting the layout, colours, font and background as desired. To access this section of Qualtrics, click on the ‘Look and feel’ icon on the navigation menu at the far left of the screen:

This page details some of the functionality available in this section of Qualtrics.
In brief, it covers how to do the following:
- Edit the survey theme
- Edit the survey background
- Edit other look and feel options, including options relating to the survey layout, general features, style, motion and logo
</div>
Survey theme
To ensure a consistent look and feel is applied to each page of a survey, Qualtrics uses survey themes. There is a library of themes to choose from, and you can customise various aspects of these themes as detailed in the sections below.
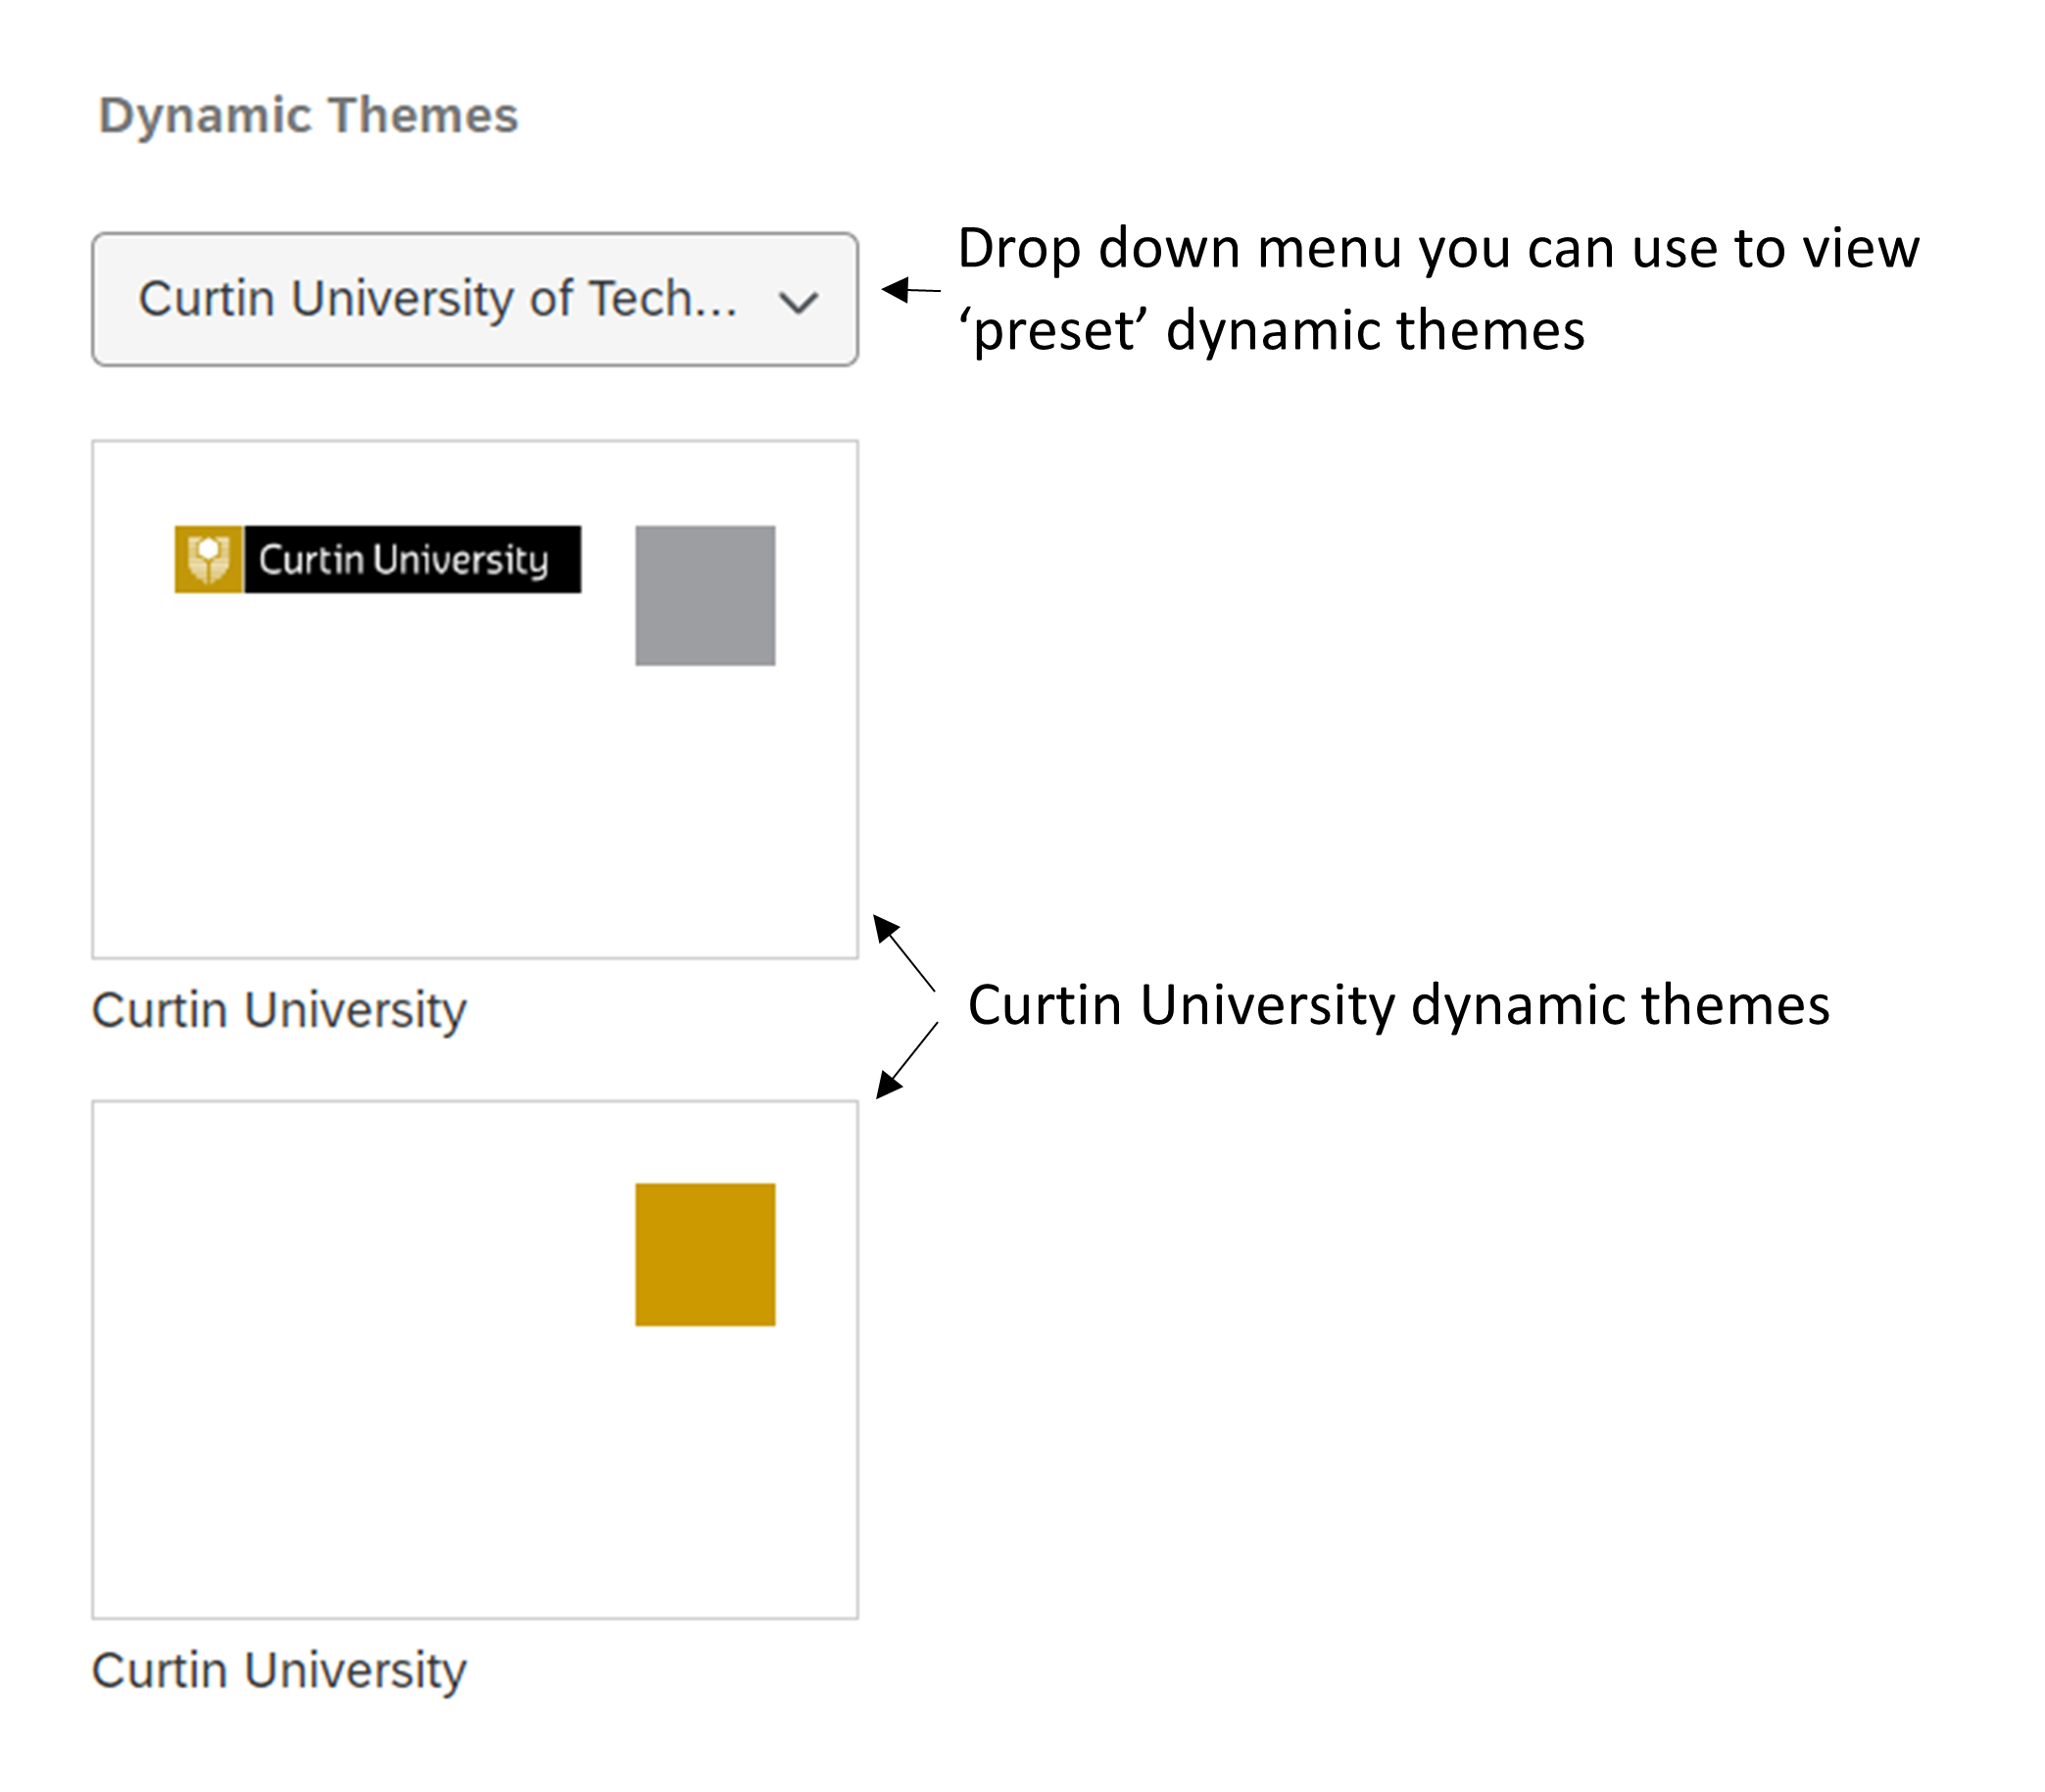
There are two different types of themes: static themes and dynamic themes. Static themes don’t allow the layout, logo or background of the theme to be customised, whereas dynamic themes allow all aspects of the theme to be customised.
If you are using the Curtin Qualtrics licence and would like your survey to have a Curtin University theme, there are two static and two dynamic themes to choose from. These dynamic themes are displayed below. Alternatively, you can choose Presets from the Dynamic Themes drop-down menu and choose from one of the other theme options, or you can start from scratch with a Blank theme. You can click on any of the themes to see a preview.
Example
For the purposes of experimenting with different looks for your Test Survey, choose the Blank dynamic theme (underneath the Curtin University dynamic themes if you are using a Curtin Qualtrics licence) and select Apply.
Survey background
If you are using a dynamic theme, you can opt for your survey to have a different background colour or image by selecting Background from the left menu.
To change the background colour, click in the Background Color box and either manually choose a colour by dragging the circle to select, or enter HEX or RGB values.
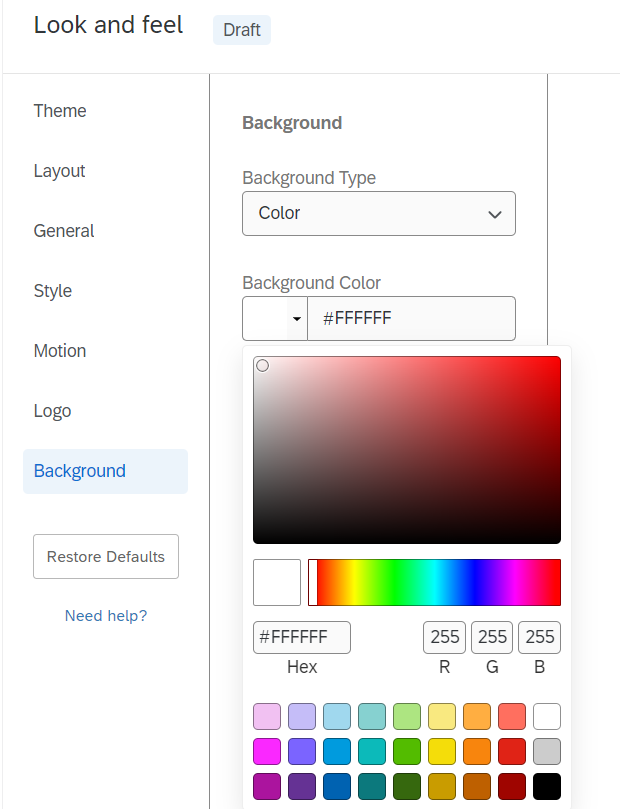
To add a background image, choose Photo from the Background Type drop down menu, then select Change Image and either click on Upload a New Graphic (which allows you to upload a graphic or to use a graphic from the web) or choose a previously uploaded image. You can then adjust the overlay colour and opacity as desired.
Example
Experiment with changing the colour or adding a background image for your Test Survey, then select Apply when you are happy with the background.
Other survey look and feel options
If you are using a dynamic theme, you can select from a choice of three different survey layouts by selecting Layout from the left menu.
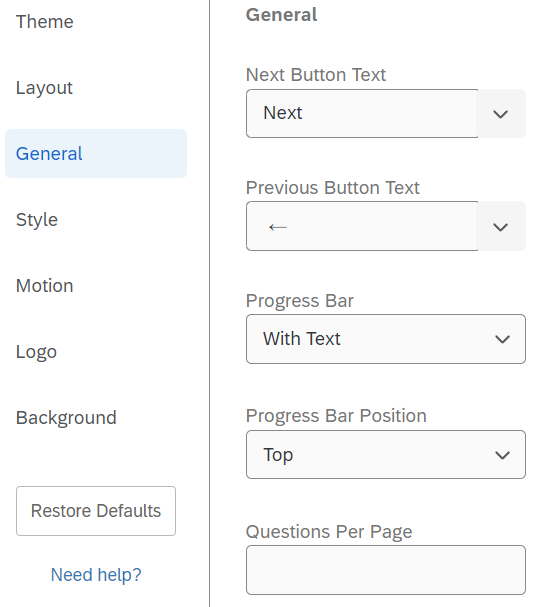
Furthermore, you can make changes to the next and previous button text, add a progress bar and/or add a header or footer to the survey by selecting General from the left menu.
You can also make changes to primary and secondary survey colours (e.g. colours of things such as the ‘Next’ boxes), adjust the font style and size, change the question spacing, and add in Custom CSS (to further customise the look and feel of the survey) by selecting Style from the left menu.
Finally, you can also make changes to the page transition by selecting Motion from the left menu, and add in a logo by selecting Logo.
Example
Select General from the left menu and update the Next Button Text to say Next throughout your Test Survey, then add a Progress Bar With Text.
Experiment with changing the colours, the font style and size and the question spacing using the options in the Style menu as well, if you like.
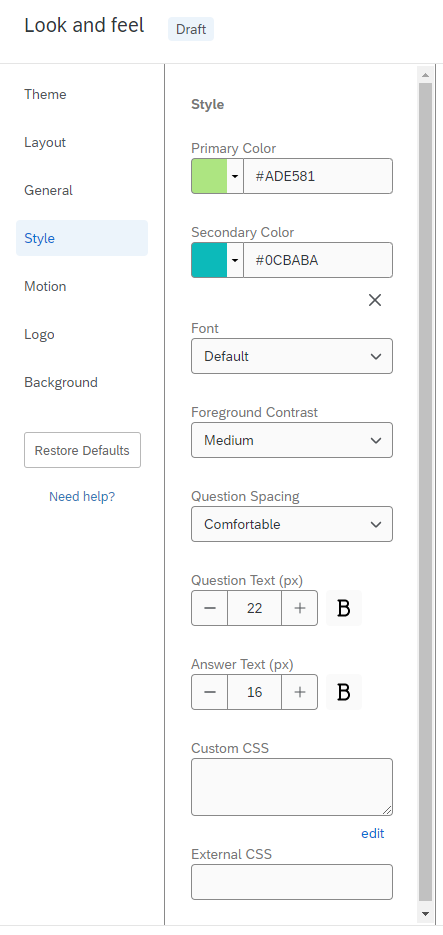
Make sure you click Apply after making any changes.
Survey options
The Survey options section of Qualtrics allows you to make a range of other changes to your survey settings, from adding a back button to sending post-survey emails and setting up scoring. To access this section of Qualtrics, click on the ‘Survey options’ icon on the navigation menu at the far left of the screen. It looks like this:

This page details some of the functionality available in this section of Qualtrics.
In brief, it covers the following:
- The standard options available, including the option to add a back button
- How to add scoring functionality to a survey
</div>
Standard options
The Survey options section contains five different options. Details of the first four of these are as follows, while the remainder of this page focuses on the ‘advanced’ option, Scoring:
- The General option allows you to change things such as the survey display name and description, and to display question numbers to respondents.
- The Responses option allows you to add a back button to your survey, and to update settings with regards to survey completion and availability.
- The Security option allows you to limit the availability of your survey, to add password protection and to anonymise responses.
- The Post-Survey option allows you to display and send customised messages and emails to survey respondents (while this includes the creation of email triggers, note that the email task feature of Workflows is currently recommended for this due to improved functionality).
Example
Add a back button to your Test Survey by selecting Responses from the left menu, then toggling on Back button (note that you may then want to change the text of this button, either for the whole survey or for specific block(s), as detailed in the Look & feel and Survey builder pages respectively).
Add visible question numbers to your Test Survey by selecting General from the left menu and toggling on Question numbers (just make sure you renumber your questions if required, as detailed in the Survey builder page).
Scoring
You can use scoring to assign point values to certain types of questions in your survey, including multiple choice, matrix, text entry and slider questions (see here for a complete list of compatible question types). Furthermore, you can use multiple scoring categories, display scores to respondents in different places and in various ways, and customise the survey based on the respondent’s score/s.
Calculating and displaying scores
To add scoring to a question or questions, select Scoring from the Survey options section of Qualtrics. The default is that there is one scoring category called Score, but you can rename this and/or add new scoring categories by selecting the Score category and clicking on Manage Categories…, or by selecting Scoring Options. To rename a category click on its name (make sure you click on the text itself), or to add a new scoring category select New Category…. At this point you can also elect to have the scoring shown at the end of the survey or after each question if desired, and you can decide what to do with empty statistics for scoring categories (the default is to treat them as 0). Once you are happy with your selections click Save.
Next, scroll through the questions in your survey on the Scoring page and assign scores to different questions and response options as required (making sure you have the relevant scoring category selected from the menu at the top, if applicable). Note that selecting Auto for any particular question will automatically score the responses in ascending order starting at 1.
Once you have finished, select Back to survey builder to navigate back to the survey. You may then like to include a score or scores as part of survey questions by using piped text (as detailed in the Question behaviour section of the Survey builder page), particularly if you did not elect to have scoring displayed automatically at the end of the survey or after each question.
Example
Let’s add a travel knowledge question to your Test Survey and use this to calculate and display a Travel Readiness score.
To do this, first add a new ‘Travel Readiness’ block to the survey, then navigate to the Survey flow section and move the new block so that it sits outside any previously created branches (if you have created these). If applicable, it should look like this:
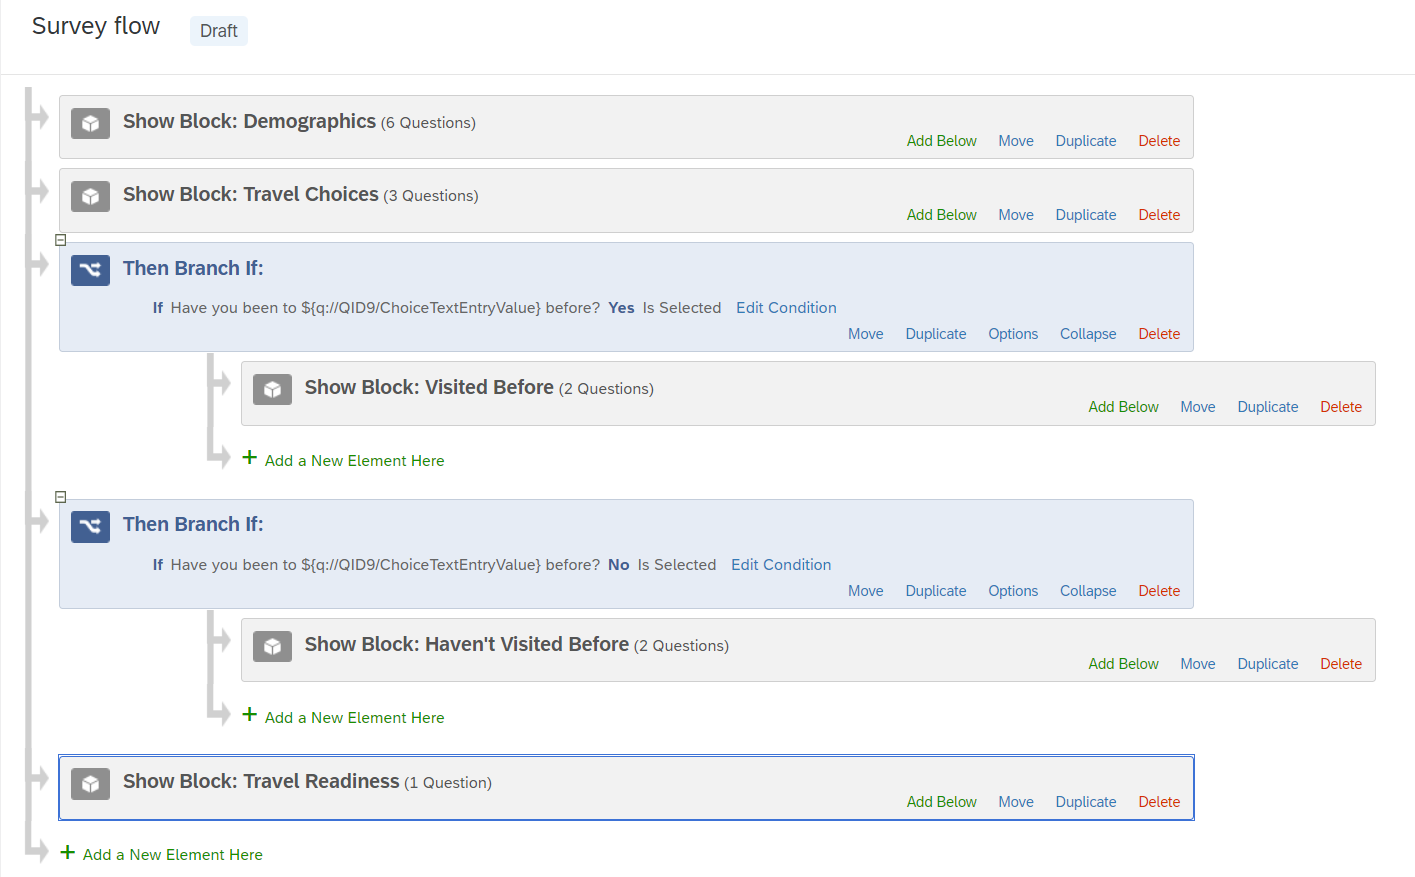
Next, add a question with options relating to travel readiness. An example has been created below, but you could create a shorter version if you wish.
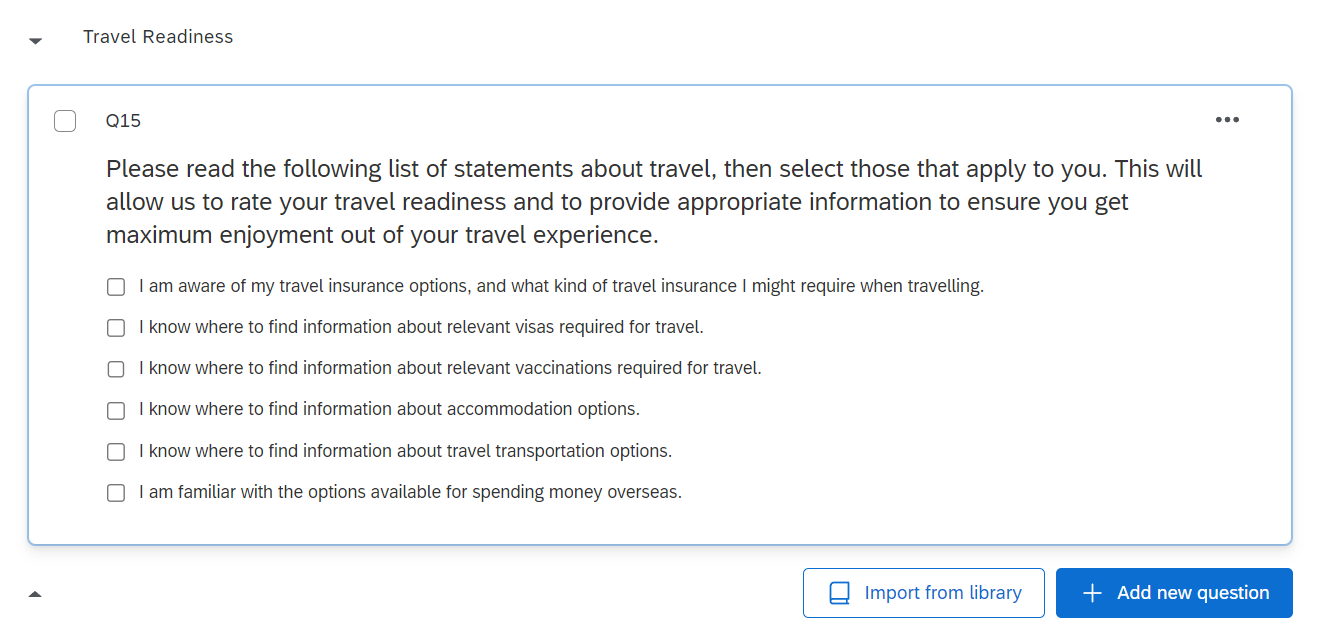
In the Answer type section of the Edit question menu on the left, make sure that you select Allow multiple answers for this question so that respondents can choose multiple statements (alternatively, you could create a set of separate ‘Yes’ or ‘No’ questions if preferred).
To add scoring to this question go to Survey options and to Scoring, then select the Score category up the top and click on Manage Categories… (or click on Scoring Options).
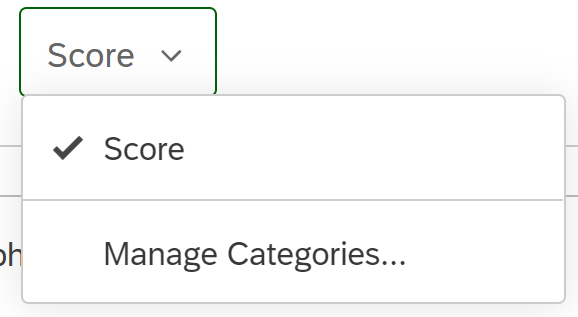
Now select Score and rename it to Travel Readiness (while this is optional, it is helpful to give your scoring categories relevant names - particularly if you are going to have more than one). Keep the two Show Scoring Summary for Category options unselected (as we will use piped text to pipe the score), and keep the Treat empty statistics for scoring categories as 0 box selected. Select Save.
Next, scroll down to the ‘Travel Readiness’ block in the Scoring page and assign a value of 1 to each of the response options for the question by selecting them in turn (as we want the score to be the number of options selected). Once you have done this, select Back to survey builder to return to the survey.
To display this score to the respondent in context on the following page of the survey, add a Text/Graphic question below the travel statement question – adding a page break in between so that the score shows on the next page. Next, use piped text (as detailed in the Piped text section of the Survey builder page) to include the score in a sentence. When you do this, you will need to select Scoring, Travel Readiness and Score for the piped text. You may also like to add /6 after the piped text so that it appears as a score out of 6 to the respondent. Your question should look something like the following (note the score ID may be different in your piped text):

Using logic with scoring
While you can include information for the respondent in one question about what to do in the case of different scores, as a next step you may want to customise your survey to provide different responses to the respondent based on their score.
One way of doing this is using branch logic, and in particular you would use this if you wanted to display a different end of survey message depending on the respondent’s score. For instructions on doing this see the Qualtrics support page on displaying messages based on scoring.
Another way of doing this is by making use of display logic (as detailed in the Question behaviour section of the Survey builder page) to display a different response (i.e. survey question) depending on the score. Doing this requires you to add an Embedded Data element (as detailed in the Embedded data section of the Survey flow page) in the survey flow. Note that this needs to sit below the block where the score is calculated, and above the block where you want to use the data. You can then use this embedded data as part of the display logic for a particular question or questions.
Example
Let’s use display logic to provide different feedback depending on the Travel Readiness score generated in your Test Survey. To do this, first move the previously created results question (in which you used piped text to display the score) to a new block called ‘Travel Readiness Results’. This should sit below the ‘Travel Readiness’ block.
Next, adjust the text of the question so that it is relevant to people who did not obtain a good score (for example, who obtained a score between 0 and 2), then add two more similar questions which are relevant to people who obtained a good and a perfect score respectively. The result should look something like this:
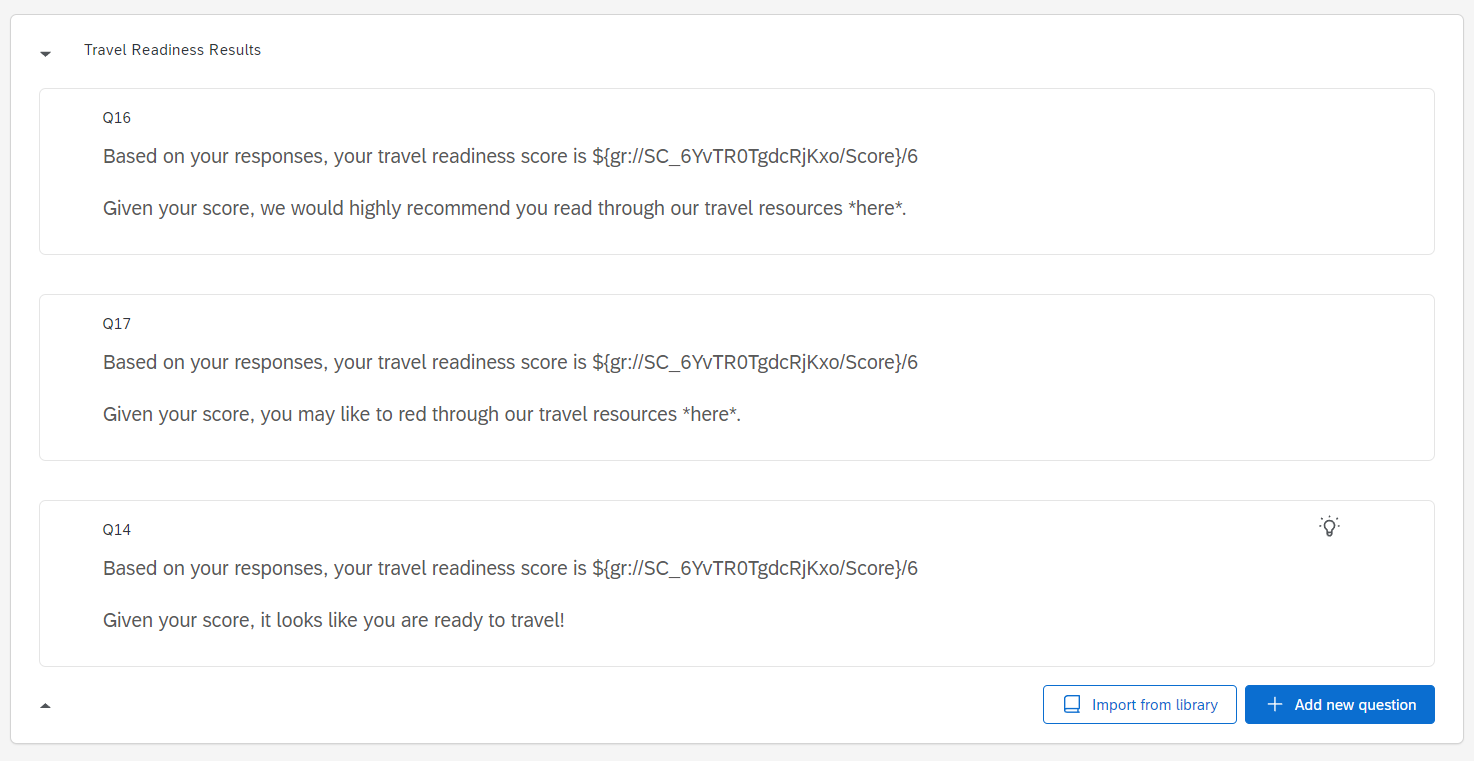
In order to add display logic for these questions based on the scoring, you first need to add an Embedded Data element to the survey flow. This needs to sit below the ‘Travel Readiness’ block (i.e. below where the score is calculated) and above the ‘Travel Readiness Results’ block (i.e. above where the data is used).
Type the name you wish to give to the embedded data inside the box; for example, Travel Readiness. Next, set the value of this embedded data to be the ‘Travel Readiness’ score, by clicking the blue Set a Value Now text, choosing Insert piped text, Scoring, Travel Readiness and then Score. It should look something like this (note that your score ID may be different):
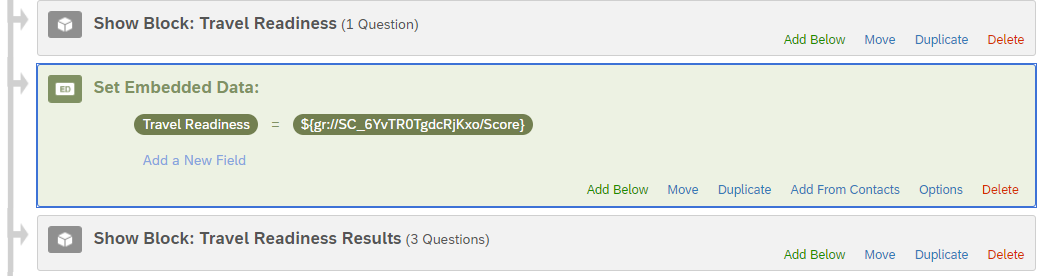
Make sure you click Apply, then head back to the survey Builder section.
You can now make use of this embedded data in the display logic. For example, go to the response meant for the people who scored between 0 and 2, and add display logic by choosing Display logic from the left hand menu, selecting Embedded Data, Travel Readiness (or whatever name you gave to the embedded data) and then Is Less Than and 3. To add the 3, click on Value and type 3 into the box. The options chosen should look like this:

Do the same thing for the remaining two questions - note that you will need to add two rows of display logic for the second question, indicating that the score needs to be both greater than 2 and less than 6 (or greater than or equal to 3, and less than or equal to 5). To add another line of display logic, click on the green + symbol to the right.
Preview the survey to check that the display logic works as you intended. Quotas
The Quotas section of Qualtrics allows you to count how many respondents have met a certain condition or conditions in your survey, and to control what happens when the quota is met. To access this section of Qualtrics, click on the ‘Quotas’ icon on the navigation menu at the far left of the screen. It looks like this:

Creating a quota
The conditions used for quotas can be based on survey questions, embedded data or other quotas, and there are a range of different things you can specify to happen when the quota is met. For example, if the survey quota has already been filled you could end the survey for the respondent, you could hide a question or a block, or you could make use of branch logic, skip logic or display logic to customise what happens (for example, you could use display logic to hide a certain choice or choices for a question if the quota has been met). You can also use a quota to limit the total number of people who take your survey.
For details on all the different ways you can use quotas explore the Qualtrics support page on quotas.
Example
Let’s use a quota to limit the number of people who take your Test Survey to 50. To do this, click on the Quotas icon and on Add a quota, then select Simple Logic Quota and press Create quota. Select the name of the quota (currently ‘New Quota’, at the top left of screen) and change it to something more descriptive (for example, Response Limit), then adjust the quota from 100 to 50 by changing the value in the box at the top right of screen.
Next, set the condition for when the quota will be incremented. In this instance you want every survey respondent to be counted as part of the quota, so keep Question selected and choose a question in your survey that everyone will see – for example the first question with the survey introduction. Click Select Choice and choose the question again, then keep Is Displayed selected.
Finally, scroll down and choose what you want to happen when the quota has been met (select Quota options to expand this section if required). In this case the best choice is to Prevent all new survey sessions, and you can then choose to show a custom inactive survey message (you can create this in a similar way to an end of survey message, as described in the End of survey message section of the Survey builder page). You then also have the choice to Keep & record or Delete over quota options (which in this instance would only be relevant in the event that two people submitted their survey at the same time).
To test that your quota works in the way you expect, you can increase the quota to the maximum value by selecting the 0 in 0/50 at the top right of screen, changing the quota count to 50 and pressing Save and Confirm. If you then preview the survey, you should see your inactive survey message displayed. Once you have checked it is working correctly, go back into Quotas and either change the quota count back to 0 in the same way as you previously set it to 50, or select the name of the quota from the left hand menu (i.e. Response Limit), click on the three dots to display the menu and then select Reset quota and Confirm.Translations
The Translations section of Qualtrics allows you to add multiple language options to your survey. To access this section of Qualtrics, click on the ‘Translations’ icon on the navigation menu at the far left of the screen. It looks like this:

Adding translations
Once in the Translations section you can select a Base language for your survey (the language you wrote it in, and the one in which you would like your data displayed), and add any additional language options. You will then need to translate each of the questions in your survey into the specified additional language or languages, which you can either do manually (if you are familiar with the language), or using the auto-translate feature which uses Google Translate (although it is highly recommended that you have someone check and edit the translation as required). Participants can then choose to view the survey in a language other than the base language when they commence the survey if wished.
Note that there are also other options for deciding which language is displayed to participants, for example by using Query strings, as described in the Qualtrics support page on translations.
Example
Let’s add a language option of your choice to your Test Survey. To do this, click on the Translations icon and select Add language from the menu on the left, then either click on the name of that language from the list on the left, or click on the three dots next to the language on the right and select View incomplete translations.
For each question in the survey, either type the translation in the box on the right (if you are familiar with the language), or select the three dots at the top right hand corner of the question and choose Auto-translate. Once you have done this for some or all of the questions, preview the survey to see the different language options. Distributing your survey
Once you have added all the elements to your survey and adjusted the look and feel as required, preview it again to check that it works and looks as you’d like it to. After you have made any necessary changes and are ready to publish, select Publish. At this time you may want to make use of the Expert Review, by clicking on View recommendations, to view suggestions for improving the survey. Once you have made any further changes, select Publish and Publish again.
Distributing a survey
Once your survey is published you will be provided with an anonymous link that you can use to distribute it. Furthermore, you can find many other ways of sharing your survey in the Distributions section of Qualtrics. These different distribution methods are listed below. Click on each method for more details.
Additionally, if you know who you want to send your survey to ahead of time, you can create a contact list to distribute your survey invitations. This list (which should include participants’ names, email addresses and any other relevant information) can be created either manually or by importing contact details. While you don’t have to set up a contact list, it can help make your survey distribution easier, and it also allows for information to be added to a participant’s responses as embedded data. For information on setting up a contact list have a look at the contacts overview page on the Qualtrics website.
Once you have distributed your survey and have received all your responses, you will need to turn your attention to analysing your data. While this isn’t covered in any detail here, note that you can either analyse your data in Qualtrics, or export it to another program for analysis (which is usually required for in-depth analysis). To export your data, go to the Data & Analysis tab, select Export & Import, choose Export… and then select your preferred file format. Feedback
If you would like to provide feedback on this module please do so by answering some or all of the questions in the form below. Alternatively for any questions about the module please contact Library-UniSkills@curtin.edu.au
We review this feedback regularly, and take your suggestions on board to improve the module. Thank you for your feedback!
Explore more here
About UniSkills
UniSkills was created and is maintained by Curtin University Library. To report issues with UniSkills contact Library Help.
Twemoji icons by Twitter, Inc and other contributors, licensed under a CC-BY 4.0 licence.
Except where otherwise noted, UniSkills content in all it’s forms (website, PDFs etc) are licensed under a Creative Commons Attribution ShareAlike 4.0 International Licence. We ask that you attribute any use of the content as created by Curtin University Library with a link to the Library website.
This license does not extend to other Curtin University and Curtin University Library webpages, or to Curtin branding and trademarks. Curtin University’s copyright information is available on the Curtin website.